
-

-


Download App
-


-

-

-
Search query too short. Please enter a full word or phrase.
-

Keywords
- Forex Trading
- Vantage Rewards
- Spreads
Popular Search
- Trading Accounts
- MT4
- MT5
- Copy Trading
- Promotions





Language


BNO NewsCommodities NewsCommodity Market NewsCrude Oil News TodayETFs NewsFeatured NewsMarket News TodayOil NewsOil Price News TodayTechnical analysisTrending NewsUSO NewsVantage News
Oil ETFs on the Radar: BNO, USO, and the Brent-WTI Spread in Focus

Vantage Editorial Team >
1 August 2026 | Market Analysis | 13 min read
Vantage Editorial Team >
Vantage is a global, multi-asset broker with a team of in-house writers and market analysts who produce educational and insightful trading content for traders of all levels.
BNO and USO get lumped together as “the oil ETFs” more often than the data supports. As of 05:54 UTC on 31 July 2026, the Vantage USO CFD, tracking the United States Oil Fund’s exposure to West Texas Intermediate (WTI) crude oil futures, traded near $127.41 on the four-hour chart. The Vantage BNO CFD, tracking the United States Brent Oil Fund’s exposure to Brent crude oil futures, sat near $49.67.
Both funds have swung hard through 2026, and the gap between what each one tracks has been a live market story all year, driven by the Middle East conflict and its effect on shipping through the Strait of Hormuz.
This piece reads the chart and the spread; it does not call a trade.
Key Points
- The Vantage USO CFD (WTI-tracking) traded near $127.41 and the Vantage BNO CFD (Brent-tracking) near $49.67 as of 05:54 UTC on 31 July 2026, with USO fractionally above its own 50-period moving average and BNO fractionally below its own 50-period moving average on the four-hour chart.
- The Brent-WTI spread widened sharply in the first quarter of 2026, averaging around $11 a barrel in March, the widest monthly average in more than five years, as Middle East-linked shipping disruption weighed more heavily on Brent than on WTI.[1]
- BNO and USO are structurally different products rather than interchangeable “oil plays”: BNO tracks a near-month Brent futures contract on ICE Futures Europe, USO tracks a near-month WTI futures contract on NYMEX, and neither fund’s share price is designed to equal the spot price of the commodity it tracks.[3,4]
What BNO and USO actually track
Both funds share the same sponsor. United States Commodity Funds LLC (USCF) is the general partner behind USO and BNO alike, along with several other single-commodity funds.[3,4] That shared structure is largely where the similarity ends.
USO’s objective is for its share price to reflect the daily percentage change in a near-month WTI futures contract traded on the New York Mercantile Exchange (NYMEX), delivered to Cushing, Oklahoma.[5] The fund rolls its position into the next month’s contract on a schedule set out in its prospectus; from January 2026, that roll window shortened from ten trading days to five.[5] BNO’s objective is the equivalent exercise for Brent: a near-month Brent futures contract on ICE Futures Europe, rolling into the next contract once the near-month position is within two weeks of expiry.[4]
The physical difference between the two benchmarks matters as much as the paperwork. WTI is a landlocked, inland grade produced largely from US shale basins and stored at Cushing, moved mostly by pipeline. Brent is a waterborne blend of North Sea crude, used as the reference for most internationally traded barrels and far more exposed to shipping routes through chokepoints such as the Strait of Hormuz.
One point worth flagging for anyone comparing the two charts directly: neither fund’s share price is designed to equal the spot price of the commodity it tracks in dollar terms.[4] The roughly $78 gap between USO’s $127.41 and BNO’s $49.67 reflects each fund’s own net asset value history, not the Brent-WTI futures spread, which is a separate, much smaller number, covered below.
The Brent-WTI spread in 2026: what’s driving it

The Brent-WTI spread, the dollar difference between the two futures benchmarks, is one of the more closely watched numbers in the crude oil market this year. According to the US Energy Information Administration (EIA), the spread began the first quarter of 2026 near $4 a barrel, then widened sharply through March, peaking at $25 a barrel on 31 March and averaging around $11 a barrel for the month, the widest monthly average in more than five years.[1]
The EIA’s April Short-Term Energy Outlook attributed that widening to two forces pulling in opposite directions.[2] Brent, priced for global delivery, absorbed most of the premium tied to reduced disruption risk around the Strait of Hormuz and the wider Middle East conflict; shipping trackers have put normal flow through the waterway at around 20 million barrels a day, a large share of seaborne crude trade.[7] WTI’s increase was comparatively contained, held back by above-average US inventories and policy moves including a Strategic Petroleum Reserve release and a temporary Jones Act waiver that eased domestic shipping constraints.[2]
The spread has narrowed a long way from March’s extremes since then, though it has not disappeared. Based on Vantage’s own crude oil coverage, WTI traded near $85.98 and Brent near $91.25 as of 06:15 UTC on 30 July 2026, implying a spread of roughly $5 a barrel, a figure best read as an approximate snapshot rather than an official EIA print.[6] Brent still carries a persistent premium tied to its global, seaborne exposure, one that widens or narrows with the perceived state of Middle East shipping risk rather than with US-specific supply and demand alone.
How the two ETFs have performed relative to each other

Read on their own charts, USO and BNO have traced a broadly similar shape through 2026: both funds have moved through a round trip of a strong rally, a sharp pullback, and a renewed push higher, consistent with the pattern described in the underlying WTI and Brent futures.[6,7] The correlation is real; the scale is not identical, and the current session shows why.
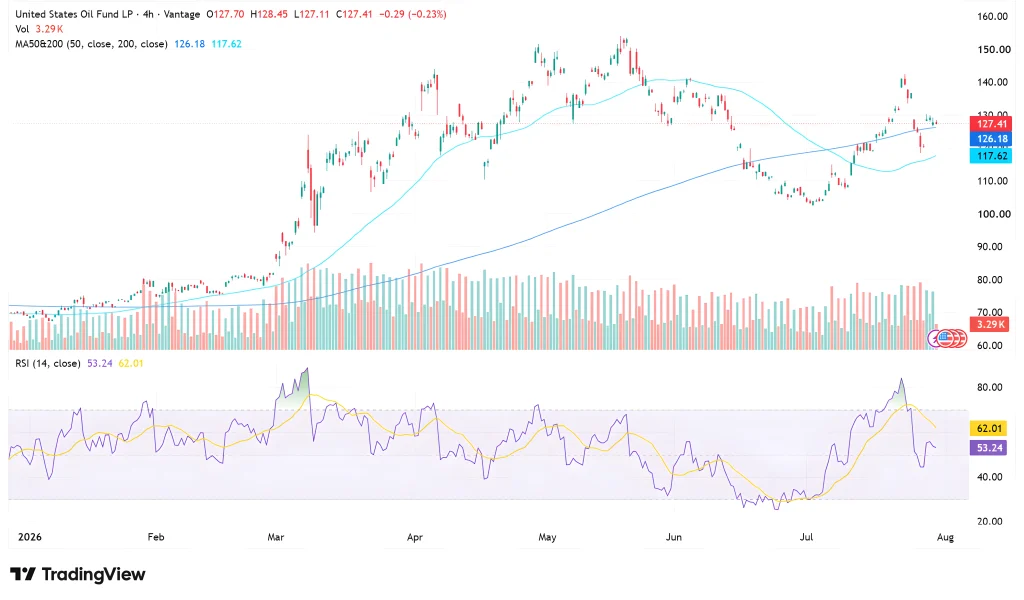
On the four-hour chart used for this analysis, the Vantage USO CFD opened at $127.70, ranged between $128.45 and $127.11, and last traded near $127.41, down $0.29 (-0.23%) on the session, with volume near 3.29K on the Vantage CFD feed. Price sits fractionally above its own 50-period moving average of $126.18 and well above its 200-period moving average of $117.62. The RSI (14, close) on the TradingView setup used for this analysis reads 53.24, below its own moving-average line of 62.01, pointing to cooling momentum after a stronger run earlier in July.
The Vantage BNO CFD opened at $49.63, ranged between $49.88 and $49.55, and last traded near $49.67, up $0.04 (+0.08%), with volume near 1.78K on the Vantage CFD feed. Price sits fractionally below its own 50-period moving average of $49.71, though still well clear of its 200-period average of $45.57. RSI here reads 54.03 against a moving-average line of 62.24, a similar momentum cooldown to USO’s.
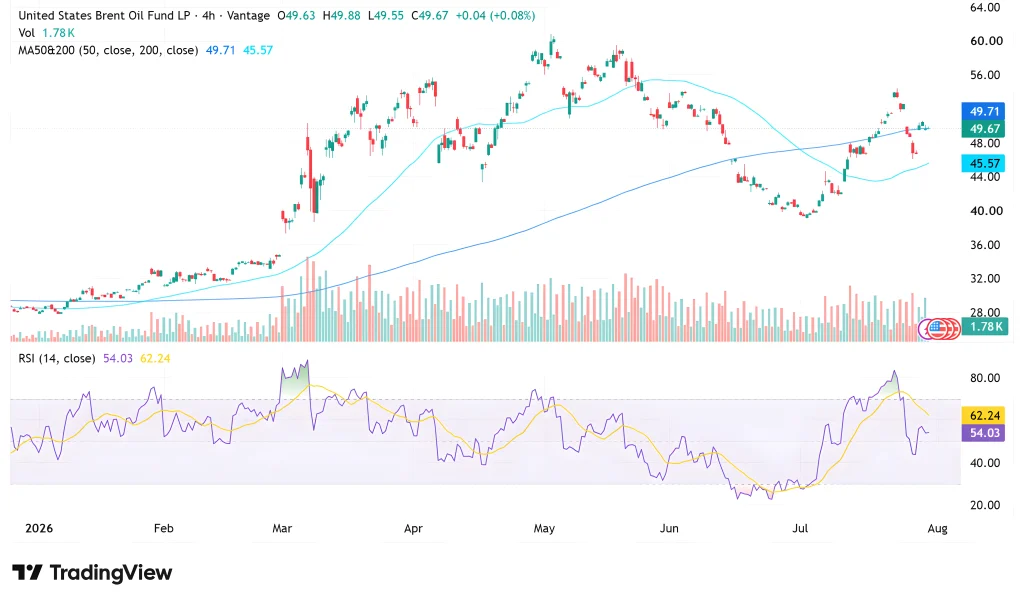
The two funds moved in slightly different directions this session, USO down and BNO up, a small reminder that correlated does not mean identical.
Levels traders are watching
The table below covers the reference zones active traders are monitoring on both share CFDs. These are reference levels, not trade signals.
| Instrument | 50-period MA | 200-period MA | RSI (14) | What’s happening |
| USO CFD (WTI) | $126.18 | $117.62 | 53.24 | Fractionally above its 50-period average after the late-July rebound |
| BNO CFD (Brent) | $49.71 | $45.57 | 54.03 | Fractionally below its 50-period average, well above its 200-period average |
Table 1: Key levels as of 05:54 UTC, 31 July 2026. Sources: Vantage CFD feed, TradingView. Indicative only.
Both charts currently sit inside a fairly tight band relative to the wider 2026 range on each instrument. USO’s session high of $128.45 and BNO’s session high of $49.88 are the nearer intraday references, with the respective 50-period and 200-period moving averages providing the wider structural zones traders are watching heading into next week.
What to watch and risk considerations
- EIA Weekly Petroleum Status Report, next release: updated US commercial crude inventory and Strategic Petroleum Reserve data, the clearest near-term read on how the physical market is absorbing the recent volatility.[8]
- Strait of Hormuz shipping data, ongoing: tanker-tracking updates remain a clearer gauge of disruption risk around the waterway than the headlines alone.
- Next EIA Short-Term Energy Outlook: will show whether the agency revises its spread assumptions given the past month’s volatility.[2]
- OPEC+ output signals, ongoing: producer-group commentary remains a swing factor for both benchmarks given the tighter inventory picture.
Both USO and BNO have moved several dollars within a single session at points this year, and today’s four-hour ranges are a reminder of how quickly that can widen again. Traders holding exposure across BNO, USO, and the underlying UKOUSD or USOUSD crude oil CFDs may want to review their combined exposure, since all three respond to the same Middle East headlines and can move together in a fast market. Stop Loss placement around the moving-average levels above is one reference point some traders monitor during periods of elevated volatility.
Leverage works both ways in a market this headline-driven, magnifying gains and losses alike. Position sizing relative to account equity is worth revisiting for anyone holding correlated positions across crude oil CFDs and oil-tracking ETF CFDs, particularly around inventory data releases and fast-moving geopolitical developments.
RISK WARNING: CFDs are complex financial instruments and carry a high risk of losing money rapidly due to leverage. You should ensure you fully understand the risks involved and carefully consider whether you can afford to take the high risk of losing your money before trading.
Disclaimer: The information is provided for educational purposes only and doesn’t take into account your personal objectives, financial circumstances, or needs. It does not constitute investment advice. We encourage you to seek independent advice if necessary. The information has not been prepared in accordance with legal requirements designed to promote the independence of investment research. No representation or warranty is given as to the accuracy or completeness of any information contained within. This material may contain historical or past performance figures and should not be relied on. Furthermore estimates, forward-looking statements, and forecasts cannot be guaranteed. The information on this site and the products and services offered are not intended for distribution to any person in any country or jurisdiction where such distribution or use would be contrary to local law or regulation. Terms and conditions apply.
References
[1] “Crude oil and petroleum product prices increased sharply in the first quarter of 2026 – U.S. Energy Information Administration” https://www.eia.gov/todayinenergy/detail.php?id=67424 Accessed on 31 July 2026.
[2] “Short-Term Energy Outlook, April 2026 – U.S. Energy Information Administration” https://www.eia.gov/outlooks/steo/archives/apr26.pdf Accessed on 31 July 2026.
[3] “USO | United States Oil Fund | The Original Oil ETF – USCF Investments” https://www.uscfinvestments.com/uso Accessed on 31 July 2026.
[4] “BNO | United States Brent Oil Fund | Brent Oil ETF – USCF Investments” https://www.uscfinvestments.com/bno Accessed on 31 July 2026.
[5] “United States Oil Fund, LP – Form 424B3 Prospectus Supplement – SEC EDGAR” https://www.sec.gov/Archives/edgar/data/1327068/000207187625000081/i25397_uso-424b3.htm Accessed on 31 July 2026.
[6] “WTI, Brent Crude Oil Price Today: Mideast Tensions Lift Oil – Vantage Markets” https://vantagemarektsdev.canglankeji.com/market-analysis/ukousd-usousd-crude-oil-news-today-wti-brent-iran-strikes-july-30-2026/ Accessed on 31 July 2026.
[7] “Brent, WTI Crude Oil Prices Today: Why the Rally Reversed – Vantage Markets” https://vantagemarektsdev.canglankeji.com/market-analysis/crude-oil-prices-today-brent-wti-july-28-2026/ Accessed on 31 July 2026.
[8] “Weekly Petroleum Status Report – U.S. Energy Information Administration” https://www.eia.gov/petroleum/supply/weekly/ Accessed on 31 July 2026.
Key Points In This Article

Latest Financial Market News


Market News Tags
- # USD News
- # USDCAD News
- # USDJPY News
- # USDX News
- # Forex News
- # Forex News Today
- # GBPUSD News
- # EURUSD News
- # Currency Trading News
- # AUDUSD news
Related Articles
- US Dollar Index Falls to 98.55 as Yields Ease, Fed Splits
- [DAILY TRADING] Pfizer Stock Price Today 21 August 2026 – $27.82 After CEO’s $1M Share Purchase
- [DAILY TRADING] AUD/USD Analysis 21 August 2026 — AUD/USD Hits 0.7150 as Dollar Slides, Aussie Jobs Miss
- [DAILY TRADING] Nasdaq 100 21 August 2026 – Climbs Back to 29,347 as Wall Street Waits on Jackson Hole
- PLTR Stock Price Today: August 2026 Chart Breakout & Key Levels
- [DAILY TRADING] Oracle Stock 21 August 2026 – ORCL Holds $142 as Pipeline Delay Meets Debt Fears
- [DAILY TRADING]: EUR/USD Analysis 21 August 2026 — EUR/USD Holds 1.1697, Near 3-Month High, ECB Hike Bets Firm
- [DAILY TRADING] Alibaba 21 August 2026 – BABA Stock Price Rebounds to $130.57 After Earnings Miss