
-

-


Download App
-


-

-

-
Search query too short. Please enter a full word or phrase.
-

Keywords
- Forex Trading
- Vantage Rewards
- Spreads
Popular Search
- Trading Accounts
- MT4
- MT5
- Copy Trading
- Promotions





Language

 Market Analysis Weekly Analysis The Analyst’s Read: MSFT Stock Forecast: Azure Beat Meets a Hawkish Fed Hold
Earnings News TodayFeatured NewsFinancial NewsMarket News TodayMicrosoft NewsNasdaq News TodayStock Market NewsStock Market News TodayTechnical analysisTrending NewsVantage News
The Analyst’s Read: MSFT Stock Forecast: Azure Beat Meets a Hawkish Fed Hold

Vantage Editorial Team >
31 July 2026 | Market Analysis | 13 min read
Vantage Editorial Team >
Vantage is a global, multi-asset broker with a team of in-house writers and market analysts who produce educational and insightful trading content for traders of all levels.
As of the cut-off for this analysis, 07:55 UTC on 31 July 2026, despite delivering stronger-than-expected results across its key operating metrics just two days earlier, MSFT stock is still giving ground, which is not something I see very often. Azure grew 43% last quarter, the fastest pace in four years.
The Federal Reserve held rates the same day and sounded hawkish enough to spook the wider market. Both stories are true, and right now the MSFT stock price is arguing with itself about which one wins.
What the MSFT stock chart is showing
Zoom out and the shape is almost cartoonish. MSFT opened 2026 near $480, then spent four months grinding lower, dropping under $360 by spring as investors priced in just how much Microsoft’s AI investment programme was going to cost. A recovery clawed the stock back above $460 in early June, before a second leg down dragged it toward $360 again through most of July. Rinse, repeat.
Then came the print, and the chart woke up. Microsoft’s fiscal fourth-quarter results landed on 29 July, and MSFT stock has spent the two sessions since recovering a substantial portion of that previous multi-month decline. On the TradingView setup used for this analysis, the current 4-hour candle opened at $455.99, ranged between $450.41 and $458.68, and last traded at $451.14, a pullback of 1.05% from the open, on volume of 2.04 million for that candle alone. TradingView’s overnight marker has it a touch lower still, at $447.32.
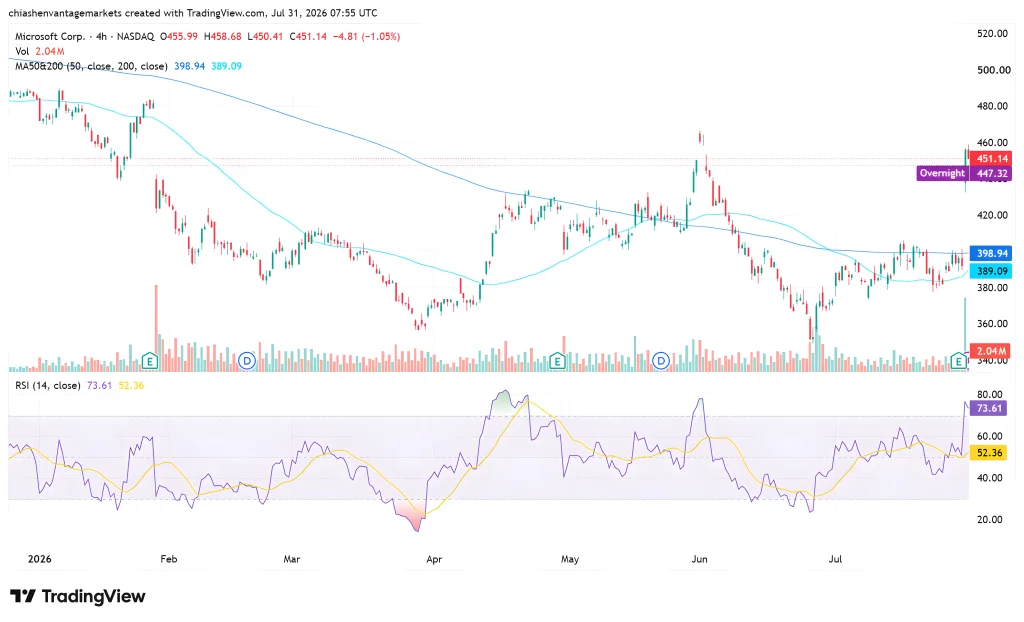
Both moving averages are sitting well beneath price, and I mean well beneath. The 50-period MA reads $398.94, the 200-period MA reads $389.09, both on the TradingView setup used for this analysis. That gap is the entire story of the past two days in one picture: this is what happens when a stock detaches from its own trend line instead of politely testing it.
The 14-period RSI backs that up. It reads 73.61, with its own moving average trailing underneath at 52.36. An RSI above 70 reflects exceptionally strong short-term momentum, although it can also signal that the recent advance has become extended. The gap between the RSI and its signal line is about as wide as I have seen on this chart since the run into the June high. My read: this is momentum that has moved fast, not momentum that has been stress-tested.
The fundamental backdrop: an Azure beat, a hawkish Fed, and a capex bill

Let’s start with the good news, because there is a lot of it. Microsoft’s fiscal fourth-quarter revenue came in at $90.0 billion, up 18% year-over-year, above Wall Street’s roughly $87.6 billion estimate.1,2 Diluted earnings per share landed at $4.81 on a GAAP basis, up 32%, or $4.74 on a non-GAAP basis once the swing from Microsoft’s OpenAI investment is stripped out.1
Azure and other cloud services revenue grew 43%, its fastest pace in four years and comfortably above the 39% to 40% constant-currency growth management had guided for the quarter, pushing Azure past $100 billion in annual revenue for the first time.1,2,3 CEO Satya Nadella called it advancing “the frontier on the cost-to-outcome curve,” which is corporate-speak for a very good quarter.1
So why did not the stock just keep going? Because the same release that delivered the good news also delivered the bill. Microsoft’s own cash flow statement puts additions to property and equipment, its core cash capex line, at $115.9 billion for fiscal 2026, up sharply from $64.6 billion a year earlier.1 On the earnings call, CFO Amy Hood confirmed fiscal 2027 capital expenditure will grow further year-over-year.4
Scotiabank expects Microsoft to increase capital expenditure further in fiscal 2027 while warning that free cash flow could come under pressure, with a capital raise of more than $20 billion likely.5 It is the same capex-return question that hit Alphabet and Tesla on 23 July, when the two stocks together shed roughly $500 billion of combined market value in a single session. Investors have become increasingly sensitive to large AI infrastructure spending commitments this earnings season, beat or no beat.5
Then there is the Fed, which picked the same day to make everyone’s life harder. The Federal Open Market Committee held its benchmark rate at 3.50% to 3.75% on 29 July, in a 9-3 vote with 3 of the 12 voting members preferring a hike.6 The statement pointed to inflation still running above the Committee’s 2% goal and cited elevated uncertainty tied in part to “the conflict in the Middle East.”6
Interest-rate futures shifted toward pricing additional tightening by year-end, a real about-face from the cutting cycle most people expected coming into the year.7 Major US indices sold off into the decision, and the 10-year Treasury yield climbed to around 4.657% as new Fed Chair Kevin Warsh wrapped up his press conference.8
Where they agree, and where they don’t
On the fundamentals, there is genuinely no argument to have. Azure at 43% is not a number anyone needs to squint at or explain away. It beat the high end of management’s own guidance, and it is the single figure that matters most for how the market prices Microsoft’s cloud and AI business.1,3 The chart agrees, at least directionally: this is the sharpest bounce on this timeframe since the multi-month downtrend started.
Where it gets interesting is the follow-through. A genuine re-rating on a 43% Azure beat does not usually fade $7 off its high inside 48 hours. I read the pullback from $458.68 to $451.14 as profit-taking running into two headwinds that have nothing to do with Microsoft’s own execution: an RSI that was already flashing overbought, and a market-wide capex-scepticism trade that had already clipped Alphabet and Tesla a week earlier.5
The Fed’s hawkish hold on the same day did not help matters. A higher-for-longer rate path drags on long-duration growth names generally, Microsoft included, regardless of anything in its own numbers.6,8
So the earnings case and the price action are not really contradicting each other. They are just running on different clocks. The fundamental re-rating looks real to me. Whether the chart hangs onto it, or hands more of it back first, is a question the next few sessions get to answer, not this one.
Levels to watch and risk framing
Table 1: MSFT levels from the TradingView setup used for this analysis, 4-hour chart, as of 07:55 UTC on 31 July 2026.
| Level | Value | What it is |
| 50-period MA | $398.94 | Trend reference, well below current price |
| 200-period MA | $389.09 | Longer-term trend reference |
| Latest 4H high | $458.68 | High of the most recent candle |
| Latest 4H low | $450.41 | Low of the most recent candle |
| Overnight marker | $447.32 | TradingView’s overnight session reference |
Data from the TradingView setup used for this analysis. Levels are reference points, not trade signals.
With both moving averages sitting more than $50 below current price, the gap between price and trend is about as wide as this chart has shown in months. I am watching whether MSFT stock can hold the $450 area that has capped the last two 4-hour candles, or whether that overbought RSI reading resolves itself the hard way, with a deeper pullback toward the moving averages instead of the moving averages catching up to price.
Microsoft’s next scheduled catalyst is its fiscal first-quarter 2027 update, plus whatever extra detail management gives on capital expenditure between now and then. For the fuller company picture, Vantage’s Microsoft stock outlook is worth a look.
Vantage MSFT CFD positions carry leverage, which magnifies both gains and losses in either direction, and that cuts both ways here given how far and how fast this move has travelled in two sessions.9 Anyone holding a position through this kind of volatility might want to revisit where their Stop Loss sits relative to the $450 area and the moving averages beneath it, rather than leaning on a fixed distance that made sense before the earnings gap opened up.10
Position sizing deserves a second look too: a move like this changes the dollar risk behind any given percentage of account equity, and leverage on Vantage MSFT CFD positions amplifies that risk further in either direction.11
Related coverage
See also MSFT stock price today: earnings preview, 27 July 2026 (Vantage), Earnings News Today (Vantage), Federal Reserve News (Vantage), and Technical Analysis (Vantage).
RISK WARNING: CFDs are complex financial instruments and carry a high risk of losing money rapidly due to leverage. You should ensure you fully understand the risks involved and carefully consider whether you can afford to take the high risk of losing your money before trading.
Disclaimer: The information is provided for educational purposes only and doesn’t take into account your personal objectives, financial circumstances, or needs. It does not constitute investment advice. We encourage you to seek independent advice if necessary. The information has not been prepared in accordance with legal requirements designed to promote the independence of investment research. No representation or warranty is given as to the accuracy or completeness of any information contained within. This material may contain historical or past performance figures and should not be relied on. Furthermore estimates, forward-looking statements, and forecasts cannot be guaranteed. The information on this site and the products and services offered are not intended for distribution to any person in any country or jurisdiction where such distribution or use would be contrary to local law or regulation.
References
[1] “FY26 Q4 – Press Releases – Investor Relations – Microsoft” https://www.microsoft.com/en-us/investor/earnings/fy-2026-q4/press-release-webcast Accessed on 31 July 2026.
[2] “Microsoft (MSFT) Q4 earnings report 2026 – CNBC” https://www.cnbc.com/2026/07/29/microsoft-msft-q4-earnings-report-2026.html Accessed on 31 July 2026.
[3] “Microsoft (MSFT) Q4 FY2026 Earnings Preview – TradingKey” https://www.tradingkey.com/analysis/stocks/us-stocks/262060902-microsoft-msft-q4-fy2026-earnings-preview-july-29-azure-capex-tradingkey Accessed on 31 July 2026.
[4] “Microsoft’s $15 Billion Capex Cut Isn’t a Cut at All – Benzinga” https://www.benzinga.com/markets/tech/26/07/60808802/microsofts-15-billion-capex-cut-isnt-a-cut-at-all Accessed on 31 July 2026.
[5] “Scotiabank cuts Microsoft stock price target on capex concerns – Investing.com” https://ca.investing.com/news/stock-market-news/scotiabank-cuts-microsoft-stock-price-target-on-capex-concerns-93CH-4759910 Accessed on 31 July 2026.
[6] “Federal Reserve issues FOMC statement” https://www.federalreserve.gov/newsevents/pressreleases/monetary20260729a.htm Accessed on 31 July 2026.
[7] “Fed’s Interest Rate Decision: July 29, 2026 – Advisor Perspectives” https://www.advisorperspectives.com/dshort/updates/2026/07/29/feds-interest-rate-decision-july-29-2026 Accessed on 31 July 2026.
[8] “Fed meeting recap: July 2026 – CNBC” https://www.cnbc.com/2026/07/29/fed-meeting-today-live-updates.html Accessed on 31 July 2026.
[9] “Trade US Share CFDs | $0 Commissions* | Vantage Markets” https://vantagemarektsdev.canglankeji.com/stocks-trading/us-shares/ Accessed on 31 July 2026.
[10] “Stop Loss Definition | Vantage” https://vantagemarektsdev.canglankeji.com/en/terminology/stop-loss-definition/ Accessed on 31 July 2026.
[11] “What is Leverage in Forex Trading? | Vantage” https://vantagemarektsdev.canglankeji.com/academy/what-is-leverage-in-forex/ Accessed on 31 July 2026.
Key Points In This Article

Latest Financial Market News


Market News Tags
- # USD News
- # USDCAD News
- # USDJPY News
- # USDX News
- # Forex News
- # Forex News Today
- # GBPUSD News
- # EURUSD News
- # Currency Trading News
- # AUDUSD news
Related Articles
- US Dollar Index Falls to 98.55 as Yields Ease, Fed Splits
- [DAILY TRADING] Pfizer Stock Price Today 21 August 2026 – $27.82 After CEO’s $1M Share Purchase
- [DAILY TRADING] AUD/USD Analysis 21 August 2026 — AUD/USD Hits 0.7150 as Dollar Slides, Aussie Jobs Miss
- [DAILY TRADING] Nasdaq 100 21 August 2026 – Climbs Back to 29,347 as Wall Street Waits on Jackson Hole
- PLTR Stock Price Today: August 2026 Chart Breakout & Key Levels
- [DAILY TRADING] Oracle Stock 21 August 2026 – ORCL Holds $142 as Pipeline Delay Meets Debt Fears
- [DAILY TRADING]: EUR/USD Analysis 21 August 2026 — EUR/USD Holds 1.1697, Near 3-Month High, ECB Hike Bets Firm
- [DAILY TRADING] Alibaba 21 August 2026 – BABA Stock Price Rebounds to $130.57 After Earnings Miss