
-

-


Download App
-


-

-

-
Search query too short. Please enter a full word or phrase.
-

Keywords
- Forex Trading
- Vantage Rewards
- Spreads
Popular Search
- Trading Accounts
- MT4
- MT5
- Copy Trading
- Promotions





Language


CPI NewsEconomic News TodayFeatured NewsFederal Reserve NewsForex NewsGoldIndices NewsInterest Rate NewsMarket News TodayNFP NewsTechnical analysisTrading NewsTrending NewsUSD NewsUSDX NewsVantage News
US Dollar Index Falls to 98.55 as Yields Ease, Fed Splits

Vantage Editorial Team >
24 August 2026 | Market Analysis | 13 min read
Vantage Editorial Team >
Vantage is a global, multi-asset broker with a team of in-house writers and market analysts who produce educational and insightful trading content for traders of all levels.
Here’s the dollar index in one sentence: it just quietly slipped to a level nobody was talking about a month ago. As of 09:06 (GMT+8) on 24 August 2026, the Vantage USDX CFD traded at 98.693, just above the 98.55 print it hit earlier in the week, its lowest level since mid-May 2026.1,2 Some call it the US Dollar Index, others the DXY index, the USD index, or simply “the dollar index” on their MarketWatch or TradingView tab. Whatever the name, the US Dollar index has handed back almost everything its earlier strength added, the same week the US 30-year Treasury yield sat near a 19-year high.
This piece reads the US Dollar Index (DXY) chart, the Fed’s divided vote, and the data still to land, ahead of a Jackson Hole symposium traders are treating as the real tie-breaker. All levels are as of the stated cut-off. Charts are indicative and from TradingView unless otherwise noted. This is not financial advice.
Key Points
- The dollar index today sits near 98.69, just above the 98.55 low touched on 22 August, its weakest level since mid-May.1,2
- A US Treasury plan to at least double its long-bond buyback pulled yields off their highs this week, and the dollar slid anyway, even as US business activity kept expanding.1,3
- EUR/USD touched a fresh three-month high near 1.1710 this week on a hawkish ECB, while USD/JPY held near 158 to 159 on possible September BOJ expectations.3,4,5,11
What the USDX Chart Is Showing
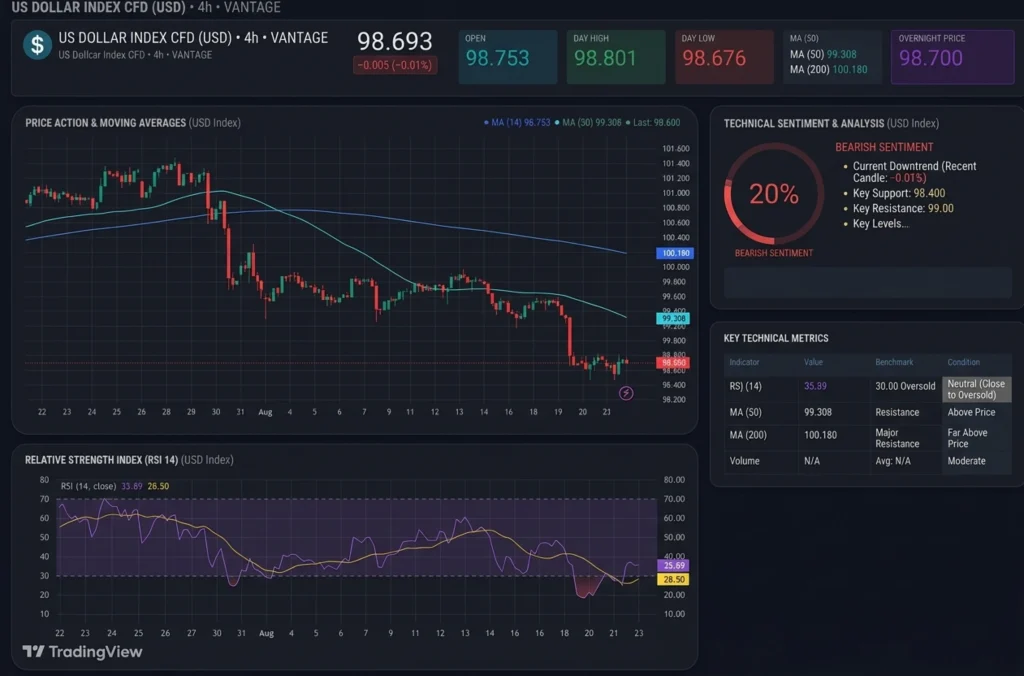
Pull up the USDX chart, or the dollar index graph on your platform of choice, and the story is right there in the candles. On the Vantage USDX CFD four-hour setup, the index climbed from around 98.70 in late July to a peak near 101.40 by 29 July 2026, then rolled over hard. By the candle closing into the 24 August cut-off, it had given back nearly the entire move: open 98.753, high 98.801, low 98.676, close 98.693, up 0.01% on the candle.
The 50-period moving average sits at 100.180 and the 200-period at 99.308, both still above price. The 50-period line has drifted lower since early August and is closing in on the 200-period line, though it hasn’t crossed below it. The Relative Strength Index (RSI) on the same chart setup reads 35.89, up from an oversold print below 20 around 19-20 August, while its own moving average lags at 28.50. RSI above its average is present positioning consistent with a market catching its breath after an oversold stretch, not proof the earlier rally is back on.
Three Things Actually Moving the Dollar
The Treasury’s Buyback Did More Than the Data
The real driver behind this dollar index chart wasn’t a data surprise, it was bond-market plumbing. The US Treasury said it will at least double its buyback of longer-dated debt starting next month, aimed at supporting liquidity and easing pressure on long-end yields.1,3 That announcement pulled the 30-year Treasury yield back off its 19-year high and lined up with the dollar sliding to its weakest since mid-May.1 Friday’s flash Purchasing Managers’ Index (PMI) surveys showed US business activity still expanding, yet the dollar didn’t budge higher. When a genuinely good print fails to lift a currency, the real driver usually sits elsewhere.1
A Fed Chair Who’s Deliberately Saying Less
The Federal Reserve held its policy rate at 3.50% to 3.75% at its 29 July 2026 meeting, but the vote split 9-3, with three regional Fed presidents, Beth Hammack, Neel Kashkari, and Lorie Logan, dissenting in favour of an immediate hike.6,7 That’s an unusually wide split for a chair’s second meeting. Kevin Warsh, who took over as Fed Chair in May 2026, has since trimmed the Federal Open Market Committee’s (FOMC) post-meeting statements and stopped submitting his own rate projection to the dot plot, a genuine break from recent Fed communication.7 Money markets are pricing roughly one-in-three odds of a September move.6,8 Warsh gives his first Jackson Hole keynote on Friday, 28 August, and a Bank of America survey of fund managers points to a consensus expectation for a neutral tone.7
The Calendar Gets Genuinely Busy
The week just gone was quiet next to what’s coming. The second estimate of second-quarter (Q2) 2026 Gross Domestic Product (GDP) lands Wednesday, 26 August, alongside the Personal Consumption Expenditures (PCE) price index for July, the Fed’s own favourite inflation gauge.8,10 Friday, 28 August then stacks two events on the same day: Warsh’s keynote and the Bureau of Labor Statistics’ (BLS) preliminary annual benchmark revision to Nonfarm Payrolls (NFP), a release that has reshaped the jobs picture before.1,8
Where EUR/USD and USD/JPY Stand
EUR/USD touched a fresh three-month high near 1.1710 on 20 August before pulling back toward the 1.1660 area, and has since held around 1.168, still its best level in roughly three months.3,11 The move has two real legs under it: a softer dollar and continued Eurozone business activity (particularly in German manufacturing), and a genuinely hawkish European Central Bank (ECB), which already lifted its deposit rate 25 basis points to 2.25% in June, held in July, and has further tightening close to fully priced for September.12 Eurozone inflation expectations for the next year eased slightly to 2.9% from 3%, still above the ECB’s 2% target.3
USD/JPY held near 158 to 159 through the week, softer than the 159.60 high printed on 18 August, as expectations build around a possible Bank of Japan move at its September meeting.4,5 Japan’s inflation accelerated for a second straight month, strengthening the case cited for BOJ tightening, while the yen still faces longer-term pressure from wide interest rate differentials and elevated import costs.5
Vantage forex CFD pricing reflects the same session-by-session moves referenced here. Leverage on any CFD position cuts both ways: it can magnify gains as easily as losses relative to capital committed, so position sizing deserves care no matter which way a pair has recently moved.
| Pair | Support | Resistance | What’s Happening |
|---|---|---|---|
| DXY | 98.50 / 98.00 | 99.30 / 100.20 | Near 98.69, testing a three-month low, both moving averages sit above price |
| EURUSD | 1.1660 / 1.1580 | 1.1710 / 1.1750 | Near a three-month high, testing resistance just above Thursday’s 1.1710 print |
| USDJPY | 156.00 | 159.60 / 160.00 | Holding below the week’s high; BOJ September expectations in the background |
Table 1: Key levels as of 24 August 2026. Sources: FXStreet, TradingEconomics, TradingView. Reference levels only. Not trade signals.
What to Watch This Week and Beyond
- Q2 GDP Second Estimate, 26 August: Second read on second-quarter growth, alongside July’s PCE price index.8,10
- Jackson Hole Symposium, 27-29 August: The Kansas City Fed’s annual gathering, themed this year around financial innovation and payments policy.7,8
- Warsh’s Jackson Hole Keynote, 28 August: Fed Chair Kevin Warsh’s first address in the role, expected around 10:00 (ET).7
- NFP Benchmark Revision, 28 August: The BLS’s preliminary annual benchmark revision to Nonfarm Payrolls, released the same day as Warsh’s speech.1,8
- FOMC Meeting, 15-16 September: The next scheduled rate decision, and the first where market pricing sits meaningfully split.7
The dollar index has moved on headlines more than on data this week, and that pattern looks set to run into a week that front-loads a GDP print, a PCE release, and a Fed chair’s first keynote within three sessions. Stop Loss placement around the 98.50 and 99.30-100.20 zones above matters more than usual in this kind of headline-driven range, and anyone holding correlated exposure across EUR/USD, USD/JPY, and gold may want to check combined exposure, since a shift in Fed positioning around Jackson Hole could move more than one pair at once.
Leverage on CFD positions, expressed as a ratio such as 1:1000, works both ways in a week like this: it can magnify potential gains as easily as potential losses relative to capital committed. Position sizing relative to account equity, rather than a fixed size, is one practical way traders manage exposure into a week this dense with scheduled catalysts.
RISK WARNING: CFDs are complex financial instruments and carry a high risk of losing money rapidly due to leverage. You should ensure you fully understand the risks involved and carefully consider whether you can afford to take the high risk of losing your money before trading.
Disclaimer: The information is provided for educational purposes only and doesn’t take into account your personal objectives, financial circumstances, or needs. It does not constitute investment advice. We encourage you to seek independent advice if necessary. The information has not been prepared in accordance with legal requirements designed to promote the independence of investment research. No representation or warranty is given as to the accuracy or completeness of any information contained within. This material may contain historical or past performance figures and should not be relied on. Furthermore estimates, forward-looking statements, and forecasts cannot be guaranteed. The information on this site and the products and services offered are not intended for distribution to any person in any country or jurisdiction where such distribution or use would be contrary to local law or regulation.
References
[1] “Forecasting the upcoming week: Warsh’s Jackson Hole debut and US inflation test a soft US Dollar – FXStreet” https://www.fxstreet.com/news/forecasting-the-upcoming-week-warshs-jackson-hole-debut-and-us-inflation-test-a-soft-us-dollar-202608212022 Accessed on 24 August 2026.
[2] “Week Ahead: Warsh At Jackson Hole – Seeking Alpha” https://seekingalpha.com/article/4939393-week-ahead-warsh-at-jackson-hole Accessed on 24 August 2026.
[3] “Euro Area Currency – TradingEconomics” https://tradingeconomics.com/euro-area/currency Accessed on 24 August 2026.
[4] “USD JPY Historical Data – Investing.com” https://www.investing.com/currencies/usd-jpy-historical-data Accessed on 24 August 2026.
[5] “Japanese Yen – Quote, Chart, Historical Data, News – TradingEconomics” https://tradingeconomics.com/japan/currency Accessed on 24 August 2026.
[6] “Kevin Warsh to Make First Jackson Hole Speech as Fed Chair – Bloomberg” https://www.bloomberg.com/news/articles/2026-08-22/kevin-warsh-to-make-first-jackson-hole-speech-as-fed-chair Accessed on 24 August 2026.
[7] “Jackson Hole 2026: What to Watch When Warsh Steps to the Podium Friday – TechTimes” https://www.techtimes.com/articles/325228/20260821/jackson-hole-2026-what-watch-when-warsh-steps-podium-friday.htm Accessed on 24 August 2026.
[8] “Jackson Hole 2026: Dates, Schedule, and Warsh’s First Speech as Fed Chair – Regards of Wallstreet” https://www.regardsofwallstreet.com/news/jackson-hole-2026-dates-schedule-warsh-first-speech Accessed on 24 August 2026.
[9] “Fed Chair Warsh’s Jackson Hole Debut: Goldman Sachs Warns of Amplified FX Volatility – BigGo Finance” https://finance.biggo.com/news/4bdca185-b608-4b0f-a895-e3f2ef41d945 Accessed on 24 August 2026.
[10] “Warsh’s Jackson Hole Debut Lands 19 Days Before the Fed Decision – CME Group” https://www.cmegroup.com/videos/2026/08/21/warsh-s-jackson-hole-debut-lands-19-days-before-the-fed-decision.html Accessed on 24 August 2026.
[11] “Daily Technical Analysis of EURUSD, USDJPY, GBPUSD, AUDUSD, USDCAD, XAUUSD, US 500, and BTCUSD for 21 August 2026 – RoboForex” https://roboforex.com/beginners/analytics/forex-forecast/forex-technical-analysis/technical-forecast-daily-2026-08-21/ Accessed on 24 August 2026.
[12] “Monetary Policy Decisions, 11 June 2026 – European Central Bank” https://www.ecb.europa.eu/press/pr/date/2026/html/ecb.mp260611~4d41bd5e83.en.html Accessed on 24 August 2026.
Key Points In This Article

Latest Financial Market News


Market News Tags
- # USD News
- # USDCAD News
- # USDJPY News
- # USDX News
- # Forex News
- # Forex News Today
- # GBPUSD News
- # EURUSD News
- # Currency Trading News
- # AUDUSD news
Related Articles
- Week Ahead: Jackson Hole and Treasury markets
- [DAILY TRADING] Pfizer Stock Price Today 21 August 2026 – $27.82 After CEO’s $1M Share Purchase
- [DAILY TRADING] AUD/USD Analysis 21 August 2026 — AUD/USD Hits 0.7150 as Dollar Slides, Aussie Jobs Miss
- [DAILY TRADING] Nasdaq 100 21 August 2026 – Climbs Back to 29,347 as Wall Street Waits on Jackson Hole
- PLTR Stock Price Today: August 2026 Chart Breakout & Key Levels
- [DAILY TRADING] Oracle Stock 21 August 2026 – ORCL Holds $142 as Pipeline Delay Meets Debt Fears
- [DAILY TRADING]: EUR/USD Analysis 21 August 2026 — EUR/USD Holds 1.1697, Near 3-Month High, ECB Hike Bets Firm
- [DAILY TRADING] Alibaba 21 August 2026 – BABA Stock Price Rebounds to $130.57 After Earnings Miss