
-

-


Download App
-


-

-

-
Search query too short. Please enter a full word or phrase.
-

Keywords
- Forex Trading
- Vantage Rewards
- Spreads
Popular Search
- Trading Accounts
- MT4
- MT5
- Copy Trading
- Promotions





Language

 Market Analysis Daily Analysis [DAILY TRADING] WTI, Brent Crude Oil Price Today, 30 July 2026 – Middle East Tensions Lift Oil
Brent Crude Oil NewsCommodities NewsCommodity Market NewsCrude Oil News TodayEconomic News TodayFeatured NewsFederal Reserve NewsInterest Rate NewsIran NewsMarket News TodayOil NewsOil Price News TodayTechnical analysisTrending NewsVantage NewsWTI Crude OIl News
[DAILY TRADING] WTI, Brent Crude Oil Price Today, 30 July 2026 – Middle East Tensions Lift Oil

Vantage Editorial Team >
30 July 2026 | Daily Analysis | 9 min read
Vantage Editorial Team >
Vantage is a global, multi-asset broker with a team of in-house writers and market analysts who produce educational and insightful trading content for traders of all levels.
Crude oil news today has one theme: whiplash. Both benchmarks slid through late July on hopes the Strait of Hormuz standoff was cooling, then rebounded hard within 48 hours as renewed Middle East tensions, including reports of fresh military action involving Iran, revived supply-disruption concerns around the Strait. As of 06:15 UTC (14:15 GMT+8) on 30 July 2026, the Vantage USOUSD CFD (WTI) trades near $85.98 and the Vantage UKOUSD CFD (Brent) trades near $91.25, both well clear of the 28 July lows.
Levels below are read from the Vantage CFD feed and the TradingView setup used for this analysis.
Key Points
- Crude oil prices today: WTI near $85.98, Brent near $91.25 as of 06:15 UTC on 30 July 2026, both rebounding hard from the 28 July lows.
- Renewed Middle East tensions, including reports of fresh military action involving Iran, and a stalled Strait of Hormuz standoff reversed June’s de-escalation; crude inventories posted the largest weekly draw since mid-June.
- Both benchmarks have reclaimed their 50-period and 200-period moving averages, and RSI on the TradingView setup used for this analysis is overbought above 70.
What the WTI and Brent crude oil price charts are showing
WTI (USOUSD)
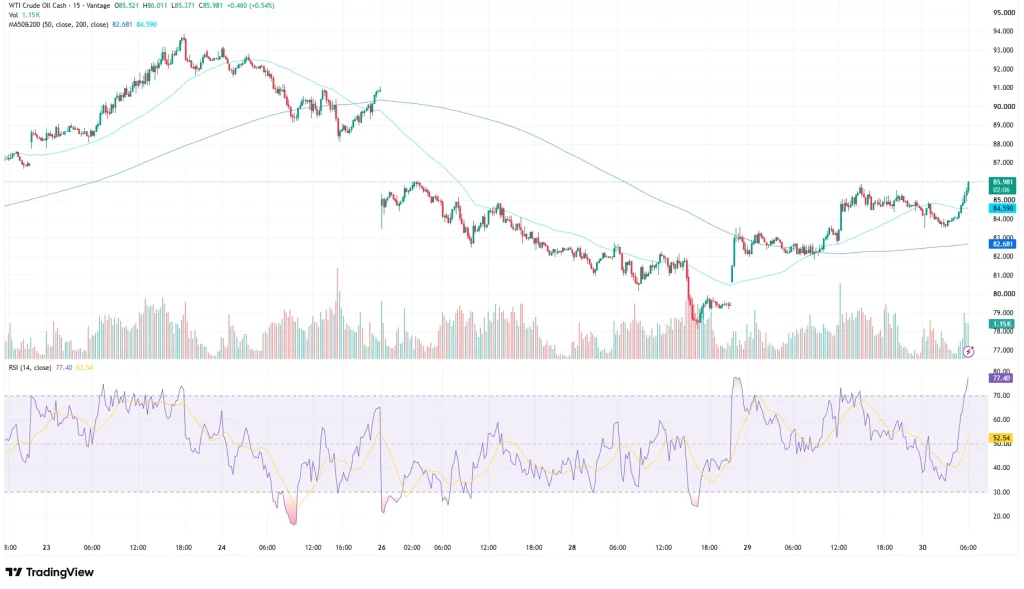
The WTI crude oil price last printed $85.98 on the Vantage USOUSD CFD, up 0.54% (open $85.52, high $86.01, low $85.37). The contract traded near $78.00 only a few sessions ago, a striking round trip. The bounce has carried WTI back above its 50-period ($82.68) and 200-period ($84.59) moving averages, and RSI on the TradingView setup used for this analysis reads 77.4, RSI moving average 52.5, solidly overbought for the first time since the rebound began. The $87.00-$88.00 shelf that held before the slide is the next resistance zone, with the 28 July low near $78.00 the nearer reference.
Brent (UKOUSD)
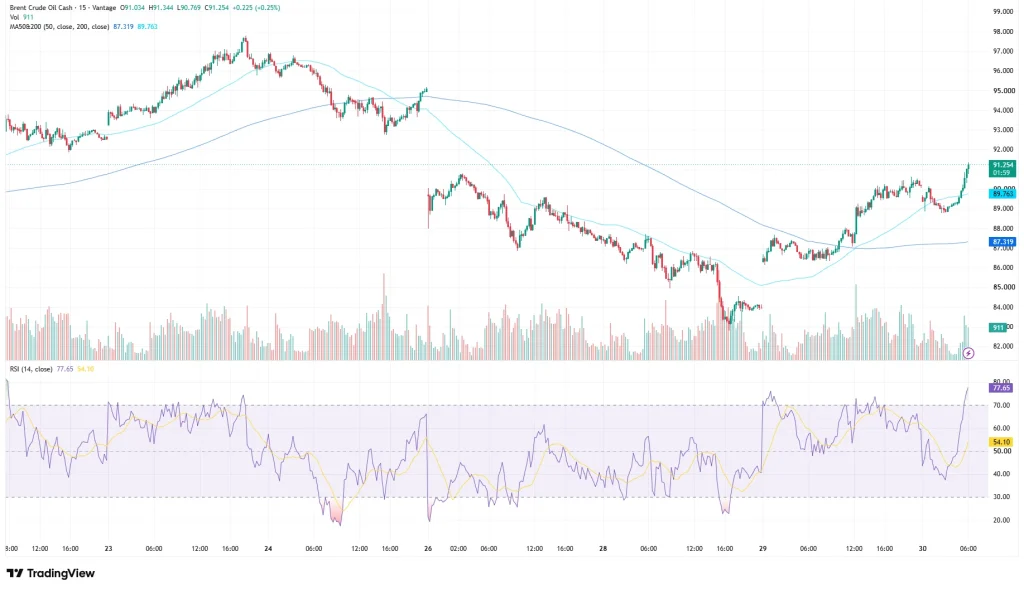
The Brent crude oil price told a near-identical story. The Vantage UKOUSD CFD last printed $91.25, up 0.25% (open $91.03, high $91.34, low $90.77), after bottoming near $83.00 on 28 July. It has reclaimed its 50-period ($87.32) and 200-period ($89.76) moving averages, and RSI on the same TradingView setup reads 77.65, RSI moving average 54.1, also overbought. The $95.00 area that capped brent oil before the sell-off is the resistance zone, with the 28 July low the nearer support. The move has erased much of the previous week’s decline in just two sessions.
Why crude oil prices are moving: renewed tensions and a tightening market
Crude has been on a volatile round trip through July. Prices eased mid-month as diplomatic contacts around the Strait of Hormuz appeared to progress, then oil rebounded as renewed Middle East tensions, including reports of fresh military action involving Iran, revived concerns about supply disruption through the Strait from 29 July.1
Tehran is still insisting on keeping control of the waterway, and the standoff has spread beyond the Strait, with Houthi forces threatening a blockade of Saudi Arabia and Riyadh joining US strikes on Iraq targets linked to Tehran-backed militants.1
The physical market is tightening alongside the headlines. US commercial crude inventories posted their largest weekly draw since mid-June, and the Strategic Petroleum Reserve has fallen for an eighteenth straight week to its lowest level since 1983.1 Crude is up more than one-fifth for the month, exactly the kind of move that lands on a central banker’s desk.
The Federal Reserve held its target rate at 3.50%-3.75% on 29 July while acknowledging elevated uncertainty around the economic outlook.3 A prolonged conflict complicates the inflation backdrop the Fed is trying to look past.4 The EIA’s outlook, published before this escalation, assumed a steadier recovery and forecast Brent in the mid-$70s for Q3, now being tested.5
Oil price chart: levels to watch
The oil price chart below covers the zones traders are monitoring across both benchmarks. These are reference levels, not trade signals.
| Instrument | Support | Resistance | What’s happening |
| USOUSD (WTI) | $82.68 / $78.00 | $87.00-88.00 / $93.50 | Reclaimed both moving averages after the 28 July low; RSI overbought |
| UKOUSD (Brent) | $87.32 / $83.50 | $95.00 / $97.50 | Reclaimed both moving averages after the 28 July low; RSI overbought |
Table 1: Key levels as of 06:15 UTC (14:15 GMT+8) on 30 July 2026. Source: Vantage CFD feed, TradingView. Indicative only.
Even after this rebound, both contracts sit well below the year’s highs. WTI’s 52-week peak is near $119.47 (9 March 2026) and brent oil’s near $120.88 (30 April 2026).6 RSI readings above 70 on both charts highlight strong upside momentum, although they also suggest the market is entering overbought territory.
What to watch this week and beyond
- Strait of Hormuz, ongoing: Reduced disruption risk would ease the supply premium; further strikes would extend it.
- EIA Weekly Petroleum Status Report, next release: Updates inventory and reserve data after the API’s 3.3-million-barrel draw.
- OPEC+ signals, ongoing: Producer-group commentary on output remains a swing factor given the tighter inventory picture.
- Jackson Hole and the next FOMC, 27-29 August and 15-16 September: Fed Chair Kevin Warsh’s remarks and the next rate decision will shape how policymakers read this month’s oil move.
The reclaimed moving-average zones and the 28 July lows may warrant closer attention during periods of elevated volatility. Position sizing and overall portfolio exposure remain particularly important while geopolitical headlines continue to drive intraday price swings.
Leverage cuts both ways in a market this headline-driven. Traders holding correlated positions across oil CFDs, energy-linked equities, and the US dollar should check their combined exposure, since a fresh escalation, or a sudden de-escalation, could move all three at once.

RISK WARNING: CFDs are complex financial instruments and carry a high risk of losing money rapidly due to leverage. You should ensure you fully understand the risks involved and carefully consider whether you can afford to take the high risk of losing your money before trading.
Disclaimer: The information is provided for educational purposes only and doesn’t take into account your personal objectives, financial circumstances, or needs. It does not constitute investment advice. We encourage you to seek independent advice if necessary. The information has not been prepared in accordance with legal requirements designed to promote the independence of investment research. No representation or warranty is given as to the accuracy or completeness of any information contained within. This material may contain historical or past performance figures and should not be relied on. Furthermore estimates, forward-looking statements, and forecasts cannot be guaranteed. The information on this site and the products and services offered are not intended for distribution to any person in any country or jurisdiction where such distribution or use would be contrary to local law or regulation. Terms and conditions apply.
References
[1] “Oil Slips Despite Fresh US Strikes on Iran – Trading Economics” https://tradingeconomics.com/commodity/crude-oil Accessed on 30 July 2026.
[2] “July Fed Meeting: Updates and Commentary – Kiplinger” https://www.kiplinger.com/investing/live/fed-meeting-updates-and-commentary-july-2026 Accessed on 30 July 2026.
[3] “Federal Reserve issues FOMC statement – Federal Reserve” https://www.federalreserve.gov/newsevents/pressreleases/monetary20260729a.htm Accessed on 30 July 2026.
[4] “Two Key Takeaways From the Fed’s Unusually Unpredictable Meeting – CNN Business” https://www.cnn.com/2026/07/29/economy/fed-rate-decision-july Accessed on 30 July 2026.
[5] “Short-Term Energy Outlook – U.S. Energy Information Administration (EIA)” https://www.eia.gov/outlooks/steo/ Accessed on 30 July 2026.
[6] “Crude Oil Price Today: July 29, 2026 – Forbes Advisor” https://www.forbes.com/advisor/investing/oil-prices-today/ Accessed on 30 July 2026.
Key Points In This Article

Latest Financial Market News


Market News Tags
- # USD News
- # USDCAD News
- # USDJPY News
- # USDX News
- # Forex News
- # Forex News Today
- # GBPUSD News
- # EURUSD News
- # Currency Trading News
- # AUDUSD news
Related Articles
- US Dollar Index Falls to 98.55 as Yields Ease, Fed Splits
- [DAILY TRADING] Pfizer Stock Price Today 21 August 2026 – $27.82 After CEO’s $1M Share Purchase
- [DAILY TRADING] AUD/USD Analysis 21 August 2026 — AUD/USD Hits 0.7150 as Dollar Slides, Aussie Jobs Miss
- [DAILY TRADING] Nasdaq 100 21 August 2026 – Climbs Back to 29,347 as Wall Street Waits on Jackson Hole
- PLTR Stock Price Today: August 2026 Chart Breakout & Key Levels
- [DAILY TRADING] Oracle Stock 21 August 2026 – ORCL Holds $142 as Pipeline Delay Meets Debt Fears
- [DAILY TRADING]: EUR/USD Analysis 21 August 2026 — EUR/USD Holds 1.1697, Near 3-Month High, ECB Hike Bets Firm
- [DAILY TRADING] Alibaba 21 August 2026 – BABA Stock Price Rebounds to $130.57 After Earnings Miss