
-

-


Download App
-


-

-

-
Search query too short. Please enter a full word or phrase.
-

Keywords
- Forex Trading
- Vantage Rewards
- Spreads
Popular Search
- Trading Accounts
- MT4
- MT5
- Copy Trading
- Promotions





Language

 Market Analysis Daily Analysis [DAILY TRADING] XAUUSD Analysis 29 July 2026 – Gold Steadies as the Fed Takes Centre Stage
Commodities NewsCommodity Market NewsEconomic News TodayFeatured NewsFederal Reserve NewsGold NewsGold News TodayGold Price NewsInterest Rate NewsMarket News TodayTechnical analysisTrending NewsVantage News
[DAILY TRADING] XAUUSD Analysis 29 July 2026 – Gold Steadies as the Fed Takes Centre Stage

Vantage Editorial Team >
29 July 2026 | Daily Analysis | 9 min read
Vantage Editorial Team >
Vantage is a global, multi-asset broker with a team of in-house writers and market analysts who produce educational and insightful trading content for traders of all levels.
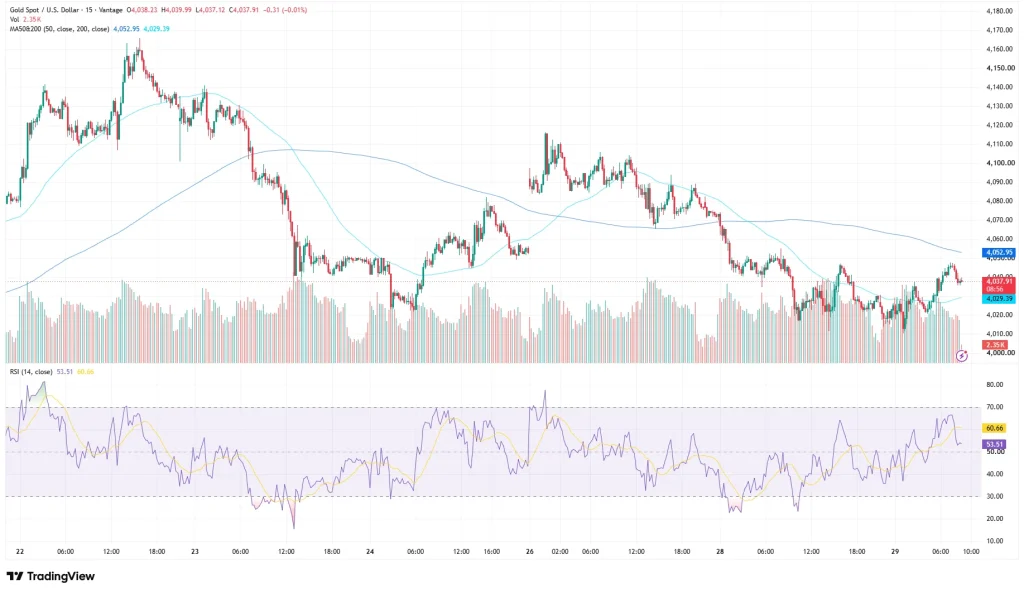
Gold is having one of those weeks where the story is the waiting, not the moving. The XAUUSD price sat at $4,037.91 on the Vantage XAUUSD CFD as of 08:56 UTC (16:56 GMT+8) on 29 July 2026, essentially flat on the session and pinned in a tight band while the market holds its breath for the Federal Reserve. Add a fresh flare-up in the Middle East, and today’s gold price news is really two stories sharing one ticker: a rate decision a few hours away, and a geopolitical risk premium that refuses to fully unwind.
XAUUSD Technical Analysis: Reading Today’s Gold Price Chart
Pull up the XAUUSD chart on TradingView and the past week reads like a small drama in three acts. Gold opened near $4,130 on 22 July, spiked to a cycle high close to $4,160 the next day, then gave almost all of it back on 24 July with a sharp drop toward $4,000. A recovery into the low $4,100s formed by 26 July, only for price to slide back toward $4,000 by 28 July. By this morning, it had steadied roughly where the week’s chaos began.
The MA50&200 overlay on the Vantage XAUUSD CFD chart puts the 50-period moving average at $4,052.95 and the 200-period at $4,029.39. Price is sandwiched between the two, a fairly literal way of saying the market cannot commit to a direction. The RSI, from the TradingView setup used for this analysis, sits at 53.51 with its signal line at 60.66, comfortably in the middle of the range and giving nothing away. The Vantage CFD feed shows 2.35K in volume on the latest 15-minute bar.
Zoom out, and gold has travelled a long way this year: an all-time high of $5,602.225 on 29 January 2026, according to TradingView, makes this week’s $4,000 to $4,160 range look almost tame.[7]
The Fed Decision Behind Today’s Gold Price News
Every gold price chart in the world is basically waiting on the same headline today. The Federal Open Market Committee wraps its two-day meeting this afternoon, with the policy statement due at 2:00pm ET, 18:00 UTC, landing at 02:00 (GMT+8) on 30 July, and Fed Chair Kevin Warsh’s press conference 30 minutes after that.[1] There is no fresh Summary of Economic Projections this time round, so the statement’s wording and whatever Warsh says off the cuff are the only new information anyone gets today.[1]
Economists surveyed widely expect the Committee to hold its target range at 3.50% to 3.75%, which would make it five straight meetings without a change.[2] The market is not fully convinced, though. There is a real, if minority, chance being priced for a further increase this week, alongside growing conviction that more tightening is coming later in the year.[3] The US Dollar Index has held near a one-month high heading in, and that firmness has been the main thing keeping gold in check.[3]
Middle East Risk and Central Bank Gold Demand
Then there is the other headline. Reports on 29 July say US forces intercepted a barrage of missile-type strikes aimed at positions in the Middle East, which has put a fresh bid under safe-haven assets even as dollar strength caps the upside.[4] The Middle East conflict is fluid enough that any escalation, or any sign of it cooling, is worth watching right alongside the Fed.
Underneath both headlines sits a quieter, slower-moving story. Central banks added a net 244 tonnes of gold to global reserves in the first quarter of 2026, according to the World Gold Council, extending a buying run that has continued even with prices near record highs.[5] It is the kind of demand that does not show up on an intraday chart, but it helps explain why gold prices keep finding a floor around $4,000 rather than falling through it.
XAUUSD Levels to Watch and What Happens Next
The table below sets out the zone the market is watching on the XAUUSD chart right now. Treat these as observed levels, not trade signals.
| Level | Price | What It Represents |
| Resistance 2 | $4,120 | 26 July swing high on the Vantage XAUUSD CFD 15-minute chart |
| Resistance 1 | $4,053 | 50-period moving average on the same chart |
| Support 1 | $4,029 | 200-period moving average on the same chart |
| Support 2 | $4,000 | Psychological handle, close to the lows seen into the 28 to 29 July session |
Levels as of 08:56 UTC (16:56 GMT+8), 29 July 2026. Source: Vantage XAUUSD CFD, TradingView. Indicative only.
Beyond the chart, the calendar does the talking this week:
- FOMC Statement and Press Conference, 29 July: release at 18:00 UTC (02:00 GMT+8, 30 July), followed by Kevin Warsh 30 minutes later.[1]
- US Q2 GDP (Advance) and June PCE Price Index, 30 July: the Fed’s preferred inflation gauge, out the morning after the decision.[6]
- Middle East developments: escalation or de-escalation, either way it tends to move fast.[4]
A $4,000 to $4,160 range in a single week is wide enough to make standard intraday assumptions feel a little optimistic. Stop Loss placement around the levels above matters more than usual heading into a scheduled, high-impact event, and if exposure spans gold, the dollar and anything Middle East linked, it is worth checking how correlated all of it really is.
Leverage cuts both ways in a session like this one, magnifying gains as easily as losses, so position sizing relative to account equity deserves another look before the Fed’s statement and Warsh’s press conference land this evening.
RISK WARNING: CFDs are complex financial instruments and carry a high risk of losing money rapidly due to leverage. You should ensure you fully understand the risks involved and carefully consider whether you can afford to take the high risk of losing your money before trading.
Disclaimer: The information is provided for educational purposes only and doesn’t take into account your personal objectives, financial circumstances, or needs. It does not constitute investment advice. We encourage you to seek independent advice if necessary. The information has not been prepared in accordance with legal requirements designed to promote the independence of investment research. No representation or warranty is given as to the accuracy or completeness of any information contained within. This material may contain historical or past performance figures and should not be relied on. Furthermore estimates, forward-looking statements, and forecasts cannot be guaranteed. The information on this site and the products and services offered are not intended for distribution to any person in any country or jurisdiction where such distribution or use would be contrary to local law or regulation.
References
[1] “Federal Reserve Board – Calendar: July 2026” https://www.federalreserve.gov/newsevents/2026-july.htm Accessed on 29 July 2026.
[2] “Will the Federal Reserve raise interest rates? Here is what experts predict for July’s meeting – CBS News” https://www.cbsnews.com/news/fed-interest-rate-decision-july-meeting/ Accessed on 29 July 2026.
[3] “Dollar eases as markets await Fed decision – CNBC” https://www.cnbc.com/2026/07/28/dollar-hits-one-month-high-on-lingering-chances-of-fed-hike.html Accessed on 29 July 2026.
[4] “Iran War Live: US Accuses IRGC of Surprise Ballistic Missile Attacks – Al Jazeera” https://www.aljazeera.com/news/liveblog/2026/7/29/iran-war-live-us-accuses-irgc-of-surprise-ballistic-missile-attacks/ Accessed on 29 July 2026.
[5] “Central Banks – Gold Demand Trends Q1 2026 – World Gold Council” https://www.gold.org/goldhub/research/gold-demand-trends/gold-demand-trends-q1-2026/central-banks Accessed on 29 July 2026.
[6] “Release Schedule – U.S. Bureau of Economic Analysis” https://www.bea.gov/news/schedule Accessed on 29 July 2026.
[7] “XAUUSD Chart, Gold Spot US Dollar Price – TradingView” https://www.tradingview.com/symbols/XAUUSD/ Accessed on 29 July 2026.
Key Points In This Article

Latest Financial Market News


Market News Tags
- # USD News
- # USDCAD News
- # USDJPY News
- # USDX News
- # Forex News
- # Forex News Today
- # GBPUSD News
- # EURUSD News
- # Currency Trading News
- # AUDUSD news
Related Articles
- US Dollar Index Falls to 98.55 as Yields Ease, Fed Splits
- [DAILY TRADING] Pfizer Stock Price Today 21 August 2026 – $27.82 After CEO’s $1M Share Purchase
- [DAILY TRADING] AUD/USD Analysis 21 August 2026 — AUD/USD Hits 0.7150 as Dollar Slides, Aussie Jobs Miss
- [DAILY TRADING] Nasdaq 100 21 August 2026 – Climbs Back to 29,347 as Wall Street Waits on Jackson Hole
- PLTR Stock Price Today: August 2026 Chart Breakout & Key Levels
- [DAILY TRADING] Oracle Stock 21 August 2026 – ORCL Holds $142 as Pipeline Delay Meets Debt Fears
- [DAILY TRADING]: EUR/USD Analysis 21 August 2026 — EUR/USD Holds 1.1697, Near 3-Month High, ECB Hike Bets Firm
- [DAILY TRADING] Alibaba 21 August 2026 – BABA Stock Price Rebounds to $130.57 After Earnings Miss