
-

-


Download App
-


-

-

-
Search query too short. Please enter a full word or phrase.
-

Keywords
- Forex Trading
- Vantage Rewards
- Spreads
Popular Search
- Trading Accounts
- MT4
- MT5
- Copy Trading
- Promotions





Language

 Market Analysis Daily Analysis [DAILY TRADING] SP500 Analysis 29 July 2026 – Chip Selloff Fades as Fed Decision Looms
Federal Reserve NewsIndices NewsInterest Rate NewsMarket News TodaySP500 NewsStock Market NewsStock Market News TodayTechnical analysisTrending NewsVantage News
[DAILY TRADING] SP500 Analysis 29 July 2026 – Chip Selloff Fades as Fed Decision Looms

Vantage Editorial Team >
29 July 2026 | Daily Analysis | 9 min read
Vantage Editorial Team >
Vantage is a global, multi-asset broker with a team of in-house writers and market analysts who produce educational and insightful trading content for traders of all levels.
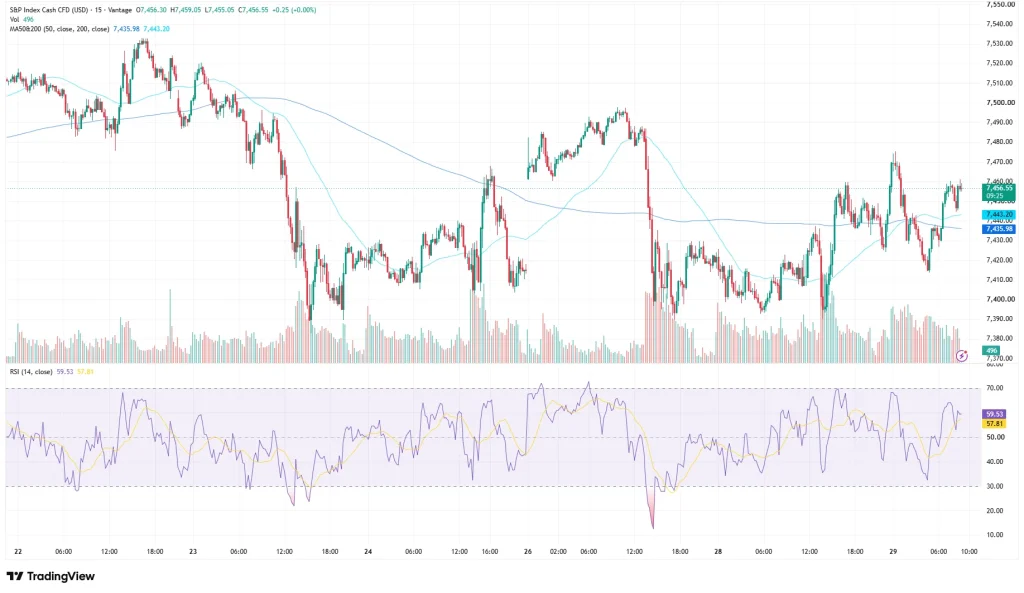
SP500 today isn’t quite living up to its reputation as the market’s steady, unbothered benchmark. The SP500 index CFD traded at 7,456.55 as of 09:05 (UTC) / 17:05 (GMT+8) on 29 July 2026, up a modest 0.25 points, according to the TradingView setup used for this analysis. That quiet number is hiding a rougher week underneath: a fast slide toward 7,380, then an equally fast climb back out of it.
A chip-sector selloff rattled the SP500 index and its peers this week, the Fed delivers its rate decision this afternoon, and Microsoft and Meta both report earnings after the US close. The SP500 also underpins much of the world’s index funds and ETFs, so today’s moves reach beyond CFD screens. This SP500 chart read sticks to what has happened, and what the calendar has next; it does not call a direction.
Key Points
- SP500 today held near 7,456, clawing back from a sharp pullback toward 7,380 tied to a chip-sector selloff out of Asia.
- The SP500 chart shows price above both the 50-period MA (7,435.98) and 200-period MA (7,443.20), while RSI (14) sat at 59.53, well off the low-30s reading printed earlier in the week.
- Two catalysts land later today: the Fed’s rate decision, Chair Warsh’s press conference, and Microsoft and Meta earnings after the US close.
What the SP500 chart is showing
Zoom out on the 15-minute SP500 chart and the past week reads like a drama in three acts: the index opened near 7,510 on 22 July, drifted to a low close near 7,405 by 24 July, then bounced into 25 and 26 July, reaching as high as roughly 7,490 before turning lower again.
Act three landed on 27 and 28 July, when chip stocks sold off hard and the SP500 index fell quickly toward the high 7,370s. RSI (14) dropped to around 32, on the setup used for this analysis, its lowest reading this week, though it did not clearly break the 30 oversold line. From there, the index recovered fast, closing the gap back above both moving averages into the 29 July session.
As of the 09:05 (UTC) / 17:05 (GMT+8) cut-off, the SP500 index price sat at 7,456.55, above the 50-period MA at 7,435.98 and the 200-period MA at 7,443.20, both on the TradingView setup used for this analysis. RSI (14) at 59.53 sits comfortably in neutral-to-firm ground, a long way from the scare it gave traders 48 hours earlier.
The Fed decision and Big Tech earnings behind today’s SP500 price
The Fed’s statement lands at 14:00 (US Eastern) / 02:00 (GMT+8, 30 July), followed by Chair Warsh’s press conference at 14:30 / 02:30. FactSet-polled economists expect a hold at 3.50%-3.75%, a fifth straight meeting unchanged, per CBS News.¹ The Fed held the same range on 17 June, Warsh’s first meeting as Chair, in a unanimous vote.² Overnight, US forces intercepted an Iranian attempted attack on troops in the Middle East, and crude jumped roughly 5%, per Bloomberg.³
That is the biggest item in today’s SP500 news, but not the only one. A chip-sector sell-off spread from South Korea, where SK Hynix and Samsung fell by double digits, into US names including Micron and AMD, per CNBC.⁴ The Dow rose on rotation into Coca-Cola and Sherwin-Williams as the Nasdaq slipped.⁴ Microsoft and Meta both report after today’s US close, with Azure growth and AI spending the swing factors for SP500 performance into tomorrow’s open.
SP500 levels to watch
The table below covers the zone traders are monitoring on the SP500 index today. These are reference levels, not trade signals.
| Instrument | Support | Resistance | What’s happening |
| SP500 | 7,380 / 7,400 | 7,459 / 7,500 | Holding above both moving averages after the chip-driven pullback |
Table 1: SP500 CFD levels as of 09:05 (UTC) / 17:05 (GMT+8), 29 July 2026. Source: TradingView setup used for this analysis, Vantage. Indicative only.
The 7,380-7,400 zone held as support through this week’s pullback, close to the lows printed on 24 and 28 July. On the upside, today’s session high of 7,459.05 sits just under 7,500, with this week’s broader bounce high running closer to 7,490.
What to watch today
- FOMC Rate Decision, 29 July: Statement due 14:00 (US Eastern) / 02:00 (GMT+8, 30 July). Markets are pricing a hold at 3.50%-3.75%, per CBS News.¹
- Fed Press Conference, 29 July: Chair Kevin Warsh speaks at 14:30 (US Eastern) / 02:30 (GMT+8, 30 July).
- Microsoft and Meta Earnings, 29 July: Both report after the US market close, with Azure growth and AI capex guidance the focus points.
- Middle East Developments: Further escalation or de-escalation following the overnight incident would likely feed through to energy prices and the inflation side of the Fed’s calculus.
This week’s SP500 chart is a reminder of how fast the index can move once one sector, chips this time, catches a cold. With a Fed decision and two earnings reports landing hours apart, Stop Loss placement around the 7,380 and 7,459 zones referenced above is one way traders keep exposure defined heading into that window.
Leverage works both ways in a session with this many scheduled catalysts. Position sizing relative to account equity is worth revisiting ahead of the Fed statement and the earnings reports, particularly for traders holding correlated exposure across US indices.
RISK WARNING: CFDs are complex financial instruments and carry a high risk of losing money rapidly due to leverage. You should ensure you fully understand the risks involved and carefully consider whether you can afford to take the high risk of losing your money before trading.
Disclaimer: The information is provided for educational purposes only and doesn’t take into account your personal objectives, financial circumstances, or needs. It does not constitute investment advice. We encourage you to seek independent advice if necessary. The information has not been prepared in accordance with legal requirements designed to promote the independence of investment research. No representation or warranty is given as to the accuracy or completeness of any information contained within. This material may contain historical or past performance figures and should not be relied on. Furthermore estimates, forward-looking statements, and forecasts cannot be guaranteed. The information on this site and the products and services offered are not intended for distribution to any person in any country or jurisdiction where such distribution or use would be contrary to local law or regulation.
References
[1] “Federal Reserve is likely to hold interest rates steady. Here’s what that means for consumers” – CBS News https://www.cbsnews.com/news/fed-interest-rate-decision-july-meeting/ Accessed on 29 July 2026.
[2] “FOMC Minutes, June 16-17, 2026 – Board of Governors of the Federal Reserve System” https://www.federalreserve.gov/monetarypolicy/fomcminutes20260617.htm Accessed on 29 July 2026.
[3] “Stock Market Today: Dow, S&P Live Updates for July 29” – Bloomberg https://www.bloomberg.com/news/articles/2026-07-28/stock-market-today-dow-s-p-live-updates Accessed on 29 July 2026.
[4] “Stock market news for July 28, 2026” – CNBC https://www.cnbc.com/2026/07/27/stock-market-today-live-updates.html Accessed on 29 July 2026.
[5] “Stock Market Today (July 28, 2026): Dow rises amid earnings reports, chip sell-off” – TheStreet https://www.thestreet.com/stock-market-today/stock-market-today-dow-jones-sp-500-nasdaq-updates-july-28-2026 Accessed on 29 July 2026.
[6] “Stock market today: Nasdaq bounces back, S&P 500 and Dow rise as earnings, falling oil prices offset chip weakness” – Yahoo Finance https://finance.yahoo.com/markets/live/stock-market-today-tuesday-july-28-dow-sp-500-nasdaq-chip-stocks-082832371.html Accessed on 29 July 2026.
[7] “United States Stock Market Index” – Trading Economics https://tradingeconomics.com/united-states/stock-market Accessed on 29 July 2026.
[8] “S&P 500 Historical Data (SPX)” – Investing.com https://www.investing.com/indices/us-spx-500-historical-data Accessed on 29 July 2026.
[9] “S&P 500 Index: A Guide to Trading the S&P 500 with CFD” – Vantage Markets https://vantagemarektsdev.canglankeji.com/academy/sp500-trading/ Accessed on 29 July 2026.
Key Points In This Article

Latest Financial Market News


Market News Tags
- # USD News
- # USDCAD News
- # USDJPY News
- # USDX News
- # Forex News
- # Forex News Today
- # GBPUSD News
- # EURUSD News
- # Currency Trading News
- # AUDUSD news
Related Articles
- US Dollar Index Falls to 98.55 as Yields Ease, Fed Splits
- [DAILY TRADING] Pfizer Stock Price Today 21 August 2026 – $27.82 After CEO’s $1M Share Purchase
- [DAILY TRADING] AUD/USD Analysis 21 August 2026 — AUD/USD Hits 0.7150 as Dollar Slides, Aussie Jobs Miss
- [DAILY TRADING] Nasdaq 100 21 August 2026 – Climbs Back to 29,347 as Wall Street Waits on Jackson Hole
- PLTR Stock Price Today: August 2026 Chart Breakout & Key Levels
- [DAILY TRADING] Oracle Stock 21 August 2026 – ORCL Holds $142 as Pipeline Delay Meets Debt Fears
- [DAILY TRADING]: EUR/USD Analysis 21 August 2026 — EUR/USD Holds 1.1697, Near 3-Month High, ECB Hike Bets Firm
- [DAILY TRADING] Alibaba 21 August 2026 – BABA Stock Price Rebounds to $130.57 After Earnings Miss