
-

-


Download App
-


-

-

-
Search query too short. Please enter a full word or phrase.
-

Keywords
- Forex Trading
- Vantage Rewards
- Spreads
Popular Search
- Trading Accounts
- MT4
- MT5
- Copy Trading
- Promotions





Language


Earnings News TodayFeatured NewsFinancial NewsMarket News TodayStock Market NewsStock Market News TodayTechnical analysisTesla NewsTrading NewsTrading OpportunitiesTrending NewsVantage News
TSLA Stock Outlook August 2026: Price Action and Key Levels

Vantage Editorial Team >
11 August 2026 | Market Analysis | 11 min read
Vantage Editorial Team >
Vantage is a global, multi-asset broker with a team of in-house writers and market analysts who produce educational and insightful trading content for traders of all levels.

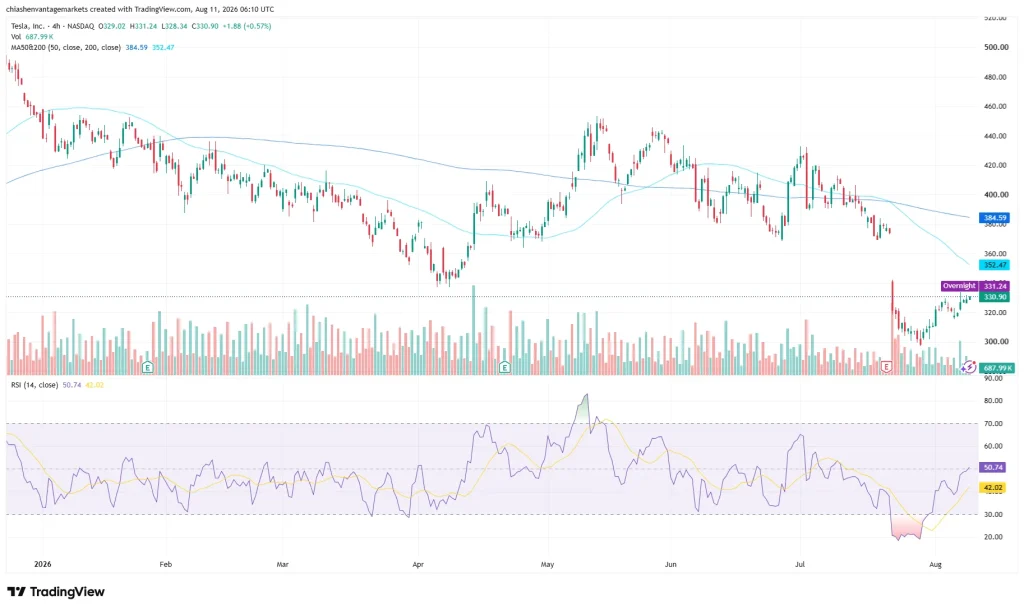
Today’s Tesla stock price is extending its rebound from the late-July low. TSLA (NASDAQ: TSLA) share CFDs traded near $330.90 as of 06:10 UTC (14:10 GMT+8) on 11 August 2026, up $1.88, or 0.57%, on the four-hour session, based on the Vantage TSLA CFD.
That’s still comfortably below both the 50-period and 200-period moving averages on the 4H chart, which tells you the recovery has a lot of ground left to cover after a bruising few weeks. This piece takes a step back for the monthly view: how TSLA’s share price has moved through August so far, the levels traders are watching, and what’s actually been driving Tesla stock news since the Q2 earnings report landed.
TSLA price action this month
TSLA spent the first half of the year proving that even the most talked-about stock on the Nasdaq isn’t immune to gravity. The stock entered 2026 in the high-$450s before sliding through the first quarter toward the $330s, a fall that erased a huge chunk of the prior year’s gains. A recovery attempt through April and May clawed price back toward the mid-$450s, but that rally ran out of road through June and July as attention turned toward second-quarter results.
The real story of the month, though, is what happened around Tesla’s earnings release on 22 July. Revenue for the quarter came in at $28.24 billion, up 26% year-on-year and comfortably ahead of consensus estimates [1]. The catch: adjusted earnings per share of $0.33 missed the $0.51 consensus by a wide margin, and operating margin narrowed to 1.4% from a year earlier [1].
The market didn’t wait around to make up its mind. The 4H chart shows one outsized down candle on heavy volume in the sessions that followed, with TSLA shares extending their slide into a 52-week low reported near $297.38 before dip-buyers finally showed up [2].
Since that low, TSLA has strung together a tidy run of higher lows on the 4H chart, climbing from the high-$290s through the $300s and into the low-$330s by 11 August. The RSI (14) on the TradingView setup used for this analysis tells the same story from a different angle: the indicator dropped into oversold territory below 30 around the late-July low before working its way back to 50.74, with its moving-average overlay still catching up at 42.02.
Volume on the way up has cooled from the earnings-week spike, sitting at 687.99K on the most recent 4H bar per the Vantage CFD feed, but the rebound in price action suggests the market is recovering, although it has yet to establish a clear new range.
Key levels to watch
The table below rounds up the reference zones visible on the TSLA chart right now. Think of these as levels traders are watching, not a script for what happens next.
| Level | Price | What it means |
| Broader downside reference | $297.38 | 52-week low reported in the days after the Q2 earnings release [2] |
| Immediate support | $303-$305 | Consolidation floor across several 4H sessions after the late-July low, based on the chart |
| Current session range | $328.34-$331.24 | 11 August 4H range; price is currently trading near the top of it |
| 200-period moving average | $352.47 | First overhead resistance on the 4H chart |
| 50-period moving average | $384.59 | Secondary overhead resistance on the 4H chart |
Table 1: Key levels as of 06:10 UTC, 11 August 2026. Sources: Vantage TSLA CFD, TradingView. Indicative only.
A couple of things jump out. Both moving averages are still sitting well above spot, which keeps this recovery filed under “bounce” rather than “trend change” for now. The $303 to $305 zone has held as a floor across several 4H sessions since the late-July low, and a break below the 52-week low near $297.38 would put TSLA into fresh 52-week-low territory. On the upside, the 200-period moving average at $352.47 looks like the first real test, if the current run higher has legs.
What’s driving the stock

Start with the earnings report, because everything else this month reads like a reaction to it. Tesla delivered a Q2-record 480,126 vehicles in the quarter, up 25% year-on-year and well clear of the roughly 406,600 analysts had modelled, alongside production of 451,758 units and 13.5 GWh of energy storage deployed, according to the company’s own filing [3].
Active Full Self-Driving subscriptions climbed to 1.48 million, up 56% year-on-year [1], and Cybercab production got underway at Gigafactory Texas alongside robotaxi operations in Austin, Dallas, Houston, Miami, Orlando and Tampa, plus supervised testing in the San Francisco Bay Area [7].
None of that stopped profitability from taking a hit: GAAP operating income fell 57% year-on-year as operating expenses jumped 47%, which the company attributed to higher spending on AI and other R&D projects, stock-based compensation including the 2025 CEO Performance Award, and SG&A [8].
Wall Street’s response has been anything but united. Jefferies analyst Philippe Houchois cut his price target on Tesla to $350 from $400 on 7 August while keeping a Hold rating, after trimming the firm’s 2026 EBIT forecast by 37% to $3.9 billion on weaker-than-expected operating leverage [4]. Tesla-SpaceX merger speculation has also resurfaced, with Elon Musk declining to rule out a combination on the TSLA earnings call, telling investors there’s “more and more overlap” between the two companies these days [5].
Then there’s the spending. Tesla’s 2026 capital expenditure guidance now tops $25 billion, with Tesla securing debt facilities providing capacity to borrow up to $30 billion to accelerate investment in robotaxi, Optimus, and AI chip manufacturing plans [6]. Management has also struck a safety-first tone on the robotaxi rollout, emphasising testing and validation as it prepares for wider expansion [7]. The next scheduled catalyst is Tesla’s Q3 earnings report, expected around 28 October 2026 [6].
For the blow-by-blow on how TSLA got here, Vantage’s earnings-eve coverage and the 6 July pullback piece are worth a look, and the Tesla News tag keeps a running feed of everything moving the stock.
Risk framing: Stop Loss and leverage
TSLA has rebounded sharply from its 52-week low in late July, with the 4H chart showing a sequence of higher lows into August. The swings around the TSLA earnings release are a good reminder of how fast a single-name share CFD can move on news.
In that kind of environment, a Stop Loss placed with reference to a specific level, such as the $303 to $305 zone or the 52-week low near $297.38, is one way traders frame their exposure on the chart above. A Stop Loss defines a planned exit level, but it does not guarantee the realised loss, particularly when prices move rapidly or gap through the level, as can happen around earnings or corporate headlines.
Leverage cuts both ways when a share CFD like TSLA is capable of moving several percentage points in a single session. Position sizing relative to account equity, together with the Stop Loss distance, tends to be the steadier approach as single-name volatility picks up, and it’s worth revisiting before Tesla’s next earnings report lands in late October.
RISK WARNING: CFDs are complex financial instruments and carry a high risk of losing money rapidly due to leverage. You should ensure you fully understand the risks involved and carefully consider whether you can afford to take the high risk of losing your money before trading.
Disclaimer: The information is provided for educational purposes only and doesn’t take into account your personal objectives, financial circumstances, or needs. It does not constitute investment advice. We encourage you to seek independent advice if necessary. The information has not been prepared in accordance with legal requirements designed to promote the independence of investment research. No representation or warranty is given as to the accuracy or completeness of any information contained within. This material may contain historical or past performance figures and should not be relied on. Furthermore estimates, forward-looking statements, and forecasts cannot be guaranteed. The information on this site and the products and services offered are not intended for distribution to any person in any country or jurisdiction where such distribution or use would be contrary to local law or regulation.
References
[1] “Tesla (TSLA) Q2 2026 earnings report – CNBC” https://www.cnbc.com/2026/07/22/tesla-tsla-q2-2026-earnings-report.html Accessed on 11 August 2026.
[2] “Tesla Price Prediction: Could the Stock Rally 30% From Here? – 24/7 Wall St.” https://247wallst.com/investing/2026/08/03/tesla-price-prediction-could-the-stock-rally-30-from-here/ Accessed on 11 August 2026.
[3] “Tesla, Inc. Form 8-K – Second Quarter 2026 Production, Deliveries & Deployments – U.S. Securities and Exchange Commission” https://www.sec.gov/Archives/edgar/data/0001318605/000162828026046717/exhibit99111111.htm Accessed on 11 August 2026.
[4] “Tesla price target lowered to $350 from $400 at Jefferies – TipRanks” https://www.tipranks.com/news/the-fly/tesla-price-target-lowered-to-350-from-400-at-jefferies-thefly-news Accessed on 11 August 2026.
[5] “Musk keeps Tesla-SpaceX merger speculation alive, cites growing overlap – Reuters via Investing.com” https://www.investing.com/news/stock-market-news/musk-keeps-teslaspacex-merger-speculation-alive-cites-growing-overlap-4807344 Accessed on 11 August 2026.
[6] “Tesla (TSLA) Earnings Date & Report – Investing.com” https://www.investing.com/equities/tesla-motors-earnings Accessed on 11 August 2026.
[7] “Tesla expands robotaxi service to Orlando and Tampa – Reuters via Investing.com” https://www.investing.com/news/stock-market-news/tesla-expands-robotaxi-service-to-orlando-and-tampa-93CH-4803559 Accessed on 11 August 2026.
[8] “Tesla Q2 2026 slides: revenue beats amid margin pressure, heavy capex – Investing.com” https://www.investing.com/news/company-news/tesla-q2-2026-slides-revenue-beats-amid-margin-pressure-heavy-capex-93CH-4807240 Accessed on 11 August 2026.
Key Points In This Article

Latest Financial Market News


Market News Tags
- # USD News
- # USDCAD News
- # USDJPY News
- # USDX News
- # Forex News
- # Forex News Today
- # GBPUSD News
- # EURUSD News
- # Currency Trading News
- # AUDUSD news
Related Articles
- US Dollar Index Falls to 98.55 as Yields Ease, Fed Splits
- [DAILY TRADING] Pfizer Stock Price Today 21 August 2026 – $27.82 After CEO’s $1M Share Purchase
- [DAILY TRADING] AUD/USD Analysis 21 August 2026 — AUD/USD Hits 0.7150 as Dollar Slides, Aussie Jobs Miss
- [DAILY TRADING] Nasdaq 100 21 August 2026 – Climbs Back to 29,347 as Wall Street Waits on Jackson Hole
- PLTR Stock Price Today: August 2026 Chart Breakout & Key Levels
- [DAILY TRADING] Oracle Stock 21 August 2026 – ORCL Holds $142 as Pipeline Delay Meets Debt Fears
- [DAILY TRADING]: EUR/USD Analysis 21 August 2026 — EUR/USD Holds 1.1697, Near 3-Month High, ECB Hike Bets Firm
- [DAILY TRADING] Alibaba 21 August 2026 – BABA Stock Price Rebounds to $130.57 After Earnings Miss