
-

-


Download App
-


-

-

-
Search query too short. Please enter a full word or phrase.
-

Keywords
- Forex Trading
- Vantage Rewards
- Spreads
Popular Search
- Trading Accounts
- MT4
- MT5
- Copy Trading
- Promotions





Language

 Market Analysis Daily Analysis [DAILY TRADING] NAS100 Analysis 11 August 2026: Nasdaq 100 Slips to 29,666 Ahead of CPI Week
Crude Oil News TodayFeatured NewsFederal Reserve NewsIran NewsMarket News TodayNAS100 NewsNasdaq News TodayOil NewsOil Price News TodayStock Market NewsStock Market News TodayTechnical analysisTrending NewsVantage News
[DAILY TRADING] NAS100 Analysis 11 August 2026: Nasdaq 100 Slips to 29,666 Ahead of CPI Week

Vantage Editorial Team >
11 August 2026 | Daily Analysis | 8 min read
Vantage Editorial Team >
Vantage is a global, multi-asset broker with a team of in-house writers and market analysts who produce educational and insightful trading content for traders of all levels.
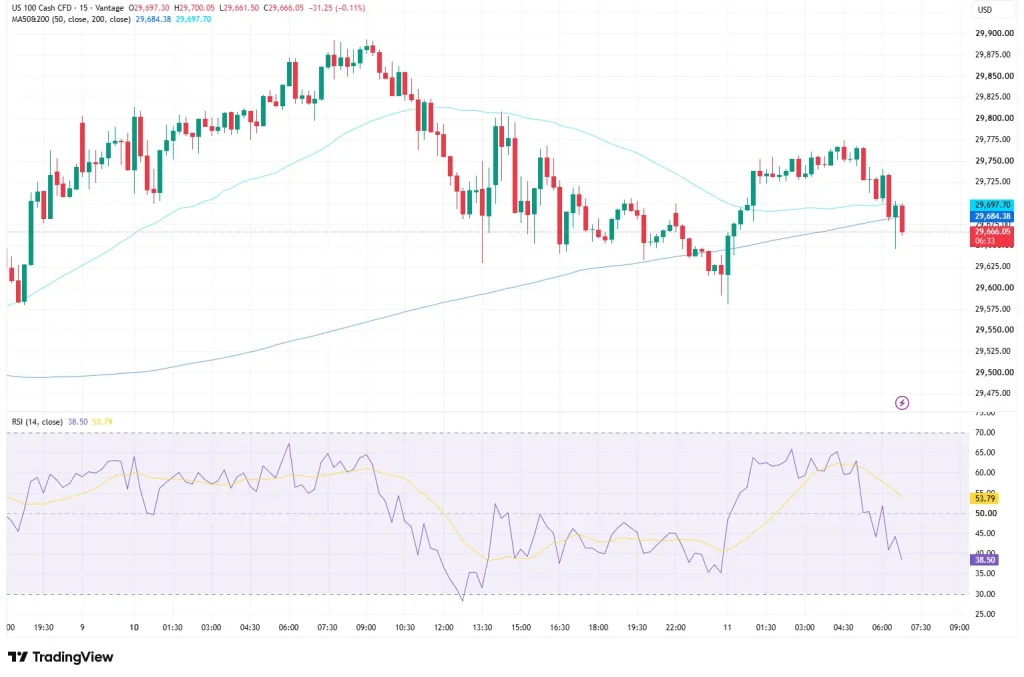
Nasdaq 100 today: the index cannot make up its mind. NAS100, the Nasdaq 100 index, traded at 29,666.05 on the Vantage NAS100 CFD as of 06:33 (GMT) on 11 August 2026, down 31.25 points, or 0.11%, on the last completed 15-minute candle. The Nasdaq price has swung across a wide band since the start of the week, and the Nasdaq index today sits almost exactly where a rally, a slide, and a bounce all collided.
This Nasdaq chart today lines up against a quiet US data slate before CPI lands on Wednesday, and that tug-of-war is shaping Nasdaq today more than any single headline. This piece reads the Nasdaq chart and the latest Nasdaq news, not where NAS100 goes next.
What the Nasdaq Chart is Showing
NAS100 climbed from around 29,590 to a session high near 29,890 during Monday’s Asian morning on 10 August, then reversed hard, finding a floor near 29,600 later that same session. It clawed back to roughly 29,780 to 29,800 early on 11 August, then rolled over again into the current 29,660s zone, proof that this Nasdaq index chart has had more mood swings than a typical Tuesday. Index CFDs trade thinly over weekends, so nearly all of this move sits inside Monday’s session.
The 50-period moving average sits at 29,684.38 and the 200-period at 29,697.70 as of the cut-off, per the TradingView setup used for this analysis. Both are bunched within roughly 30 points of price, a tight coil that tends to resolve once real volume shows up.
RSI (14) reads 38.50, sitting below its own moving average of 53.79. That reads as fading momentum, not a washout. NAS100 would need a much lower reading before anyone reasonably called this oversold.
What is Moving the Nasdaq Market Index Today

The Nasdaq stock market today is caught between fading intraday momentum and a heavier week of data still to come. Monday set the tone: the Dow Jones Industrial Average closed down 61 points, or 0.11%, while the Nasdaq Composite Index declined 0.32% and the S&P 500 slipped 0.06%, as Nvidia and Apple both fell alongside broader tech.¹ Friday’s close had set fresh records for the Dow and S&P 500, so Monday’s pullback was a step back after a strong week.²
Oil is the bigger story away from tech. Prices extended their climb into the new week as Iran tied any resolution on the Strait of Hormuz to conditions the US has not met, even as talks with Oman on transit terms were reportedly close.² Combined with Friday’s softer than expected July jobs report, that has left markets split on the Federal Reserve’s next move. TradingEconomics put the odds of a September rate hike at roughly 44% as of 9 August, down from about 67% a week earlier; Edward Jones separately pegged it below 50% post-jobs report. Either way, a hike, not a cut, is the live scenario.1,3
Today’s calendar brings the ADP weekly employment change and existing home sales figures, a warm-up act before CPI on Wednesday and PPI on Thursday.⁴ Super Micro Computer and CoreWeave both report today, part of a broader run of AI infrastructure earnings this week that also includes Nebius and Cerebras Systems and should say a lot about how real the AI build-out actually is.1,5 NAS100 has traded within a 52-week range of roughly 22,841 to 30,762 over the past year, with June’s high still the ceiling to beat.⁶ Second-quarter earnings season is also nearly done, with roughly 90% of S&P 500 names having already reported.³
Nasdaq 100 Index Levels To Watch
Here is where the Nasdaq index chart stands right now. These are reference levels, not trade signals.
| Instrument | Support | Resistance | What’s happening |
| NAS100 | 29,600 | 29,780 / 29,900 | Trading between Tuesday’s early bounce high and Monday’s swing high, with Monday’s low still the support test in play |
Table 1: Key levels as of 06:33 (GMT), 11 August 2026. Source: Vantage NAS100 CFD, TradingView. Indicative only.
Clear 29,780 to 29,900 and NAS100 is back inside the range that held for most of Monday. Lose 29,600 and it revisits Monday’s low, a level it has not traded below since the recovery began.
For active traders following NAS100 intraday, the swing between the 29,600 support and the 29,780 to 29,900 resistance band has been wide enough over the past two sessions that standard range assumptions may need revisiting. Stop Loss placement around these zones, and a check on combined exposure across correlated technology-heavy instruments, matters more heading into Wednesday’s CPI release.
Leverage works both ways in a headline-driven range like this one and is worth treating as a double-edged tool rather than a shortcut to bigger returns. Position sizing relative to account equity is worth revisiting ahead of this week’s CPI and PPI prints, given how far NAS100 has swung since Monday.
RISK WARNING: CFDs are complex financial instruments and carry a high risk of losing money rapidly due to leverage. You should ensure you fully understand the risks involved and carefully consider whether you can afford to take the high risk of losing your money before trading.
Disclaimer: The information is provided for educational purposes only and doesn’t take into account your personal objectives, financial circumstances, or needs. It does not constitute investment advice. We encourage you to seek independent advice if necessary. The information has not been prepared in accordance with legal requirements designed to promote the independence of investment research. No representation or warranty is given as to the accuracy or completeness of any information contained within. This material may contain historical or past performance figures and should not be relied on. Furthermore estimates, forward-looking statements, and forecasts cannot be guaranteed. The information on this site and the products and services offered are not intended for distribution to any person in any country or jurisdiction where such distribution or use would be contrary to local law or regulation.
References
1. “United States Stock Market Index – Trading Economics” https://tradingeconomics.com/united-states/stock-market. Accessed on 11 August 2026.
2. “Stock Market Today (Aug. 10, 2026): Dow edges lower on concerns over potential Middle East deal – TheStreet https://www.thestreet.com/stock-market-today/stock-market-today-dow-jones-sp-500-nasdaq-updates-aug-10-2026. Accessed on 11 August 2026.
3. “Stock Market News Today – Edward Jones” https://www.edwardjones.com/us-en/market-news-insights/stock-market-news/daily-market-recap. Accessed on 11 August 2026.
4. “Stock market next week: Outlook for Aug. 10-14, 2026 – CNBC” https://www.cnbc.com/2026/08/07/stock-market-next-week-outlook-for-aug-10-14-2026-.html. Accessed on 11 August 2026.
5. “Stock market today: Dow, S&P 500, Nasdaq futures little changed in wait for key inflation data – Yahoo Finance” https://finance.yahoo.com/markets/live/stock-market-today-monday-august-10-dow-sp-500-nasdaq-104358890.html. Accessed on 11 August 2026.
6. “NASDAQ 100 Index’s stock price (.NDX) – CNBC” https://www.cnbc.com/quotes/.NDX. Accessed on 11 August 2026 (52-week range as reported mid-July 2026).
Key Points In This Article

Latest Financial Market News


Market News Tags
- # USD News
- # USDCAD News
- # USDJPY News
- # USDX News
- # Forex News
- # Forex News Today
- # GBPUSD News
- # EURUSD News
- # Currency Trading News
- # AUDUSD news
Related Articles
- US Dollar Index Falls to 98.55 as Yields Ease, Fed Splits
- [DAILY TRADING] Pfizer Stock Price Today 21 August 2026 – $27.82 After CEO’s $1M Share Purchase
- [DAILY TRADING] AUD/USD Analysis 21 August 2026 — AUD/USD Hits 0.7150 as Dollar Slides, Aussie Jobs Miss
- [DAILY TRADING] Nasdaq 100 21 August 2026 – Climbs Back to 29,347 as Wall Street Waits on Jackson Hole
- PLTR Stock Price Today: August 2026 Chart Breakout & Key Levels
- [DAILY TRADING] Oracle Stock 21 August 2026 – ORCL Holds $142 as Pipeline Delay Meets Debt Fears
- [DAILY TRADING]: EUR/USD Analysis 21 August 2026 — EUR/USD Holds 1.1697, Near 3-Month High, ECB Hike Bets Firm
- [DAILY TRADING] Alibaba 21 August 2026 – BABA Stock Price Rebounds to $130.57 After Earnings Miss