
-

-


Download App
-


-

-

-
Search query too short. Please enter a full word or phrase.
-

Keywords
- Forex Trading
- Vantage Rewards
- Spreads
Popular Search
- Trading Accounts
- MT4
- MT5
- Copy Trading
- Promotions





Language


Amazon Stock NewsEarnings News TodayFeatured NewsFinancial NewsMarket News TodayStock Market NewsStock Market News TodayTechnical analysisTrading NewsTrading OpportunitiesTrending NewsVantage News
AMZN Stock Outlook August 2026: Price Action and Key Levels

Vantage Editorial Team >
13 August 2026 | Market Analysis | 12 min read
Vantage Editorial Team >
Vantage is a global, multi-asset broker with a team of in-house writers and market analysts who produce educational and insightful trading content for traders of all levels.

AMZN stock price today: $267.28, as of the cut-off at 07:32 UTC (15:32 GMT+8) on 13 August 2026, according to the Vantage AMZN CFD feed. That’s down $1.46, or 0.54%, on the latest four-hour candle, and a fair way off the $290 high the Nasdaq-listed stock touched barely ten days ago. Amazon’s (NASDAQ: AMZN) chart this month reads like a highlight reel: an earnings beat, a record high, a founder’s share sale, and a state antitrust suit, all inside three weeks.
This piece breaks down what actually moved the ticker AMZN in August, the levels traders are watching on the chart, and where the risk framing sits heading into AMZN’s next earnings date. Amazon is one of over 500 US share CFDs available through Vantage.
All prices are as of the cut-off above unless otherwise dated. Charts are indicative and from TradingView. This is not financial advice.
Key Points
- AMZN share price traded near $267.28 on 13 August 2026, pulling back from an intraday high near $290 set in early August, days after Amazon’s second-quarter earnings report.
- On the four-hour chart, the 50-period moving average sits at 247.86 and the 200-period moving average at 253.99, with the shorter-term line still running below the longer-term one even as both have turned higher.
- Morgan Stanley and J.P. Morgan both kept bullish ratings and price forecasts on AMZN stock after earnings, while a New Jersey antitrust suit and a large insider share sale have added to the near-term volatility.[1][6][7]
AMZN price action this month
Amazon’s second-quarter earnings, published 30 July 2026, did the heavy lifting. Net sales hit $200.6 billion, up 20% year-on-year, and Amazon Web Services (AWS) revenue accelerated to $42.2 billion, up 37% and the fastest pace in 18 quarters.[1][2] The market rewarded that acceleration hard: on 3 August 2026, Amazon’s market capitalisation crossed $3 trillion for the first time as the stock touched a fresh record.[3]
On the chart, that shows up as one long green candle doing most of the talking, carrying price from the low-$240s to an intraday high near $290 before RSI (14, close) pushed above 70 and the rally ran out of road. Momentum has been cooling since: RSI (14, close) now reads 53.56 against its moving-average overlay of 64.10, which looks less like a trend change and more like a spike working its way back down to earth.
Two headlines landed right as the air came out of the rally. On 4 August 2026, New Jersey’s Attorney General filed an antitrust suit against Amazon over its delivery-contractor practices.[4] Two days later, founder Jeff Bezos filed to sell more than $4 billion of stock under a prearranged Rule 10b5-1 plan.[5]
Neither changes the earnings story, but both arrived while AI-infrastructure names broadly were already being sold, which made the pullback sharper than either headline alone would explain. For a longer look at what tends to move this particular stock, AMZN, see Vantage’s broader Amazon stock overview; for how the chart looked heading into earnings, our 28 July AMZN daily has the setup traders were watching two days before the report.
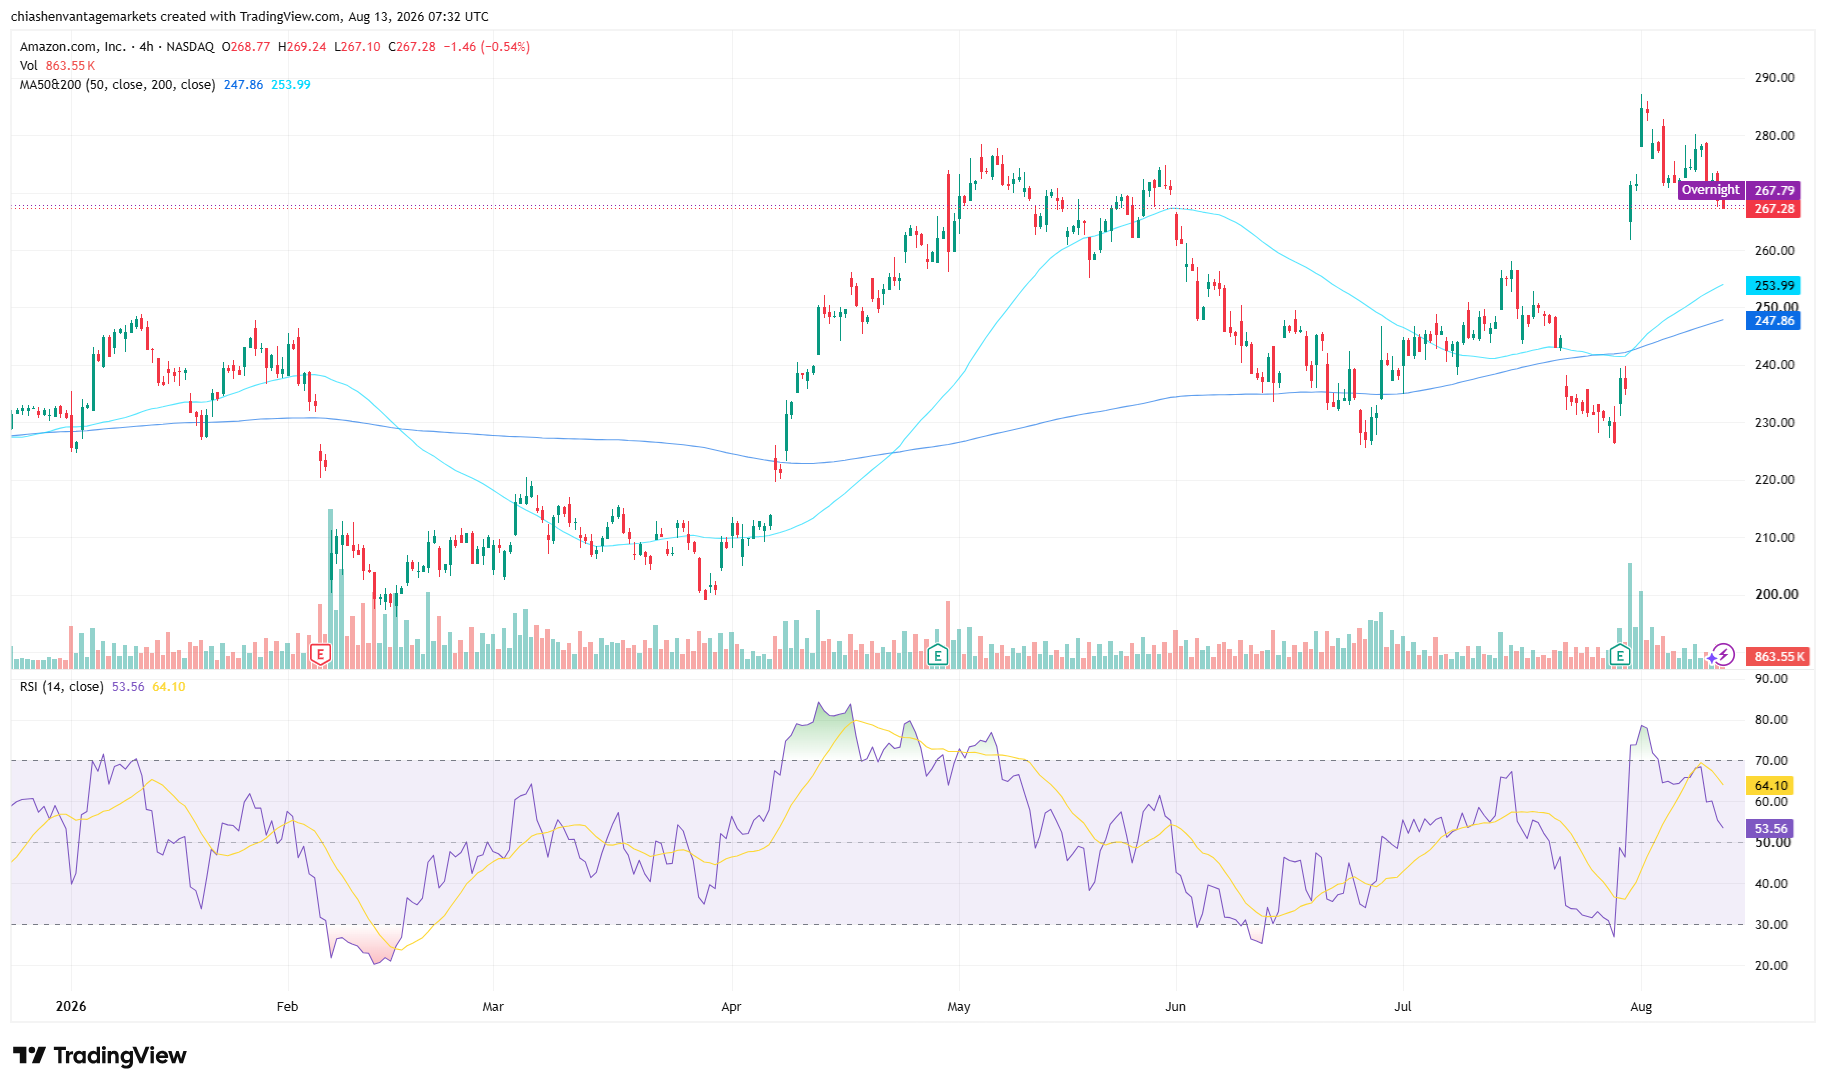
AMZN stock price: key levels to watch
The table below sets out the levels traders are watching on the four-hour chart. These are reference levels drawn from the chart and third-party technical analysis commentary, not trade signals.
| Level | Price | What’s happening |
| Record high (chart) | ~$290 | Intraday high set in early August after the second-quarter earnings rally, per the chart. |
| Resistance (prior swing zone) | ~$278 | Zone traders are watching after the pullback from the record high. |
| 200-period MA (4H) | 253.99 | Longer-term moving average, read from the chart header legend. |
| 50-period MA (4H) | 247.86 | Shorter-term moving average, still below the 200-period line even as both curl higher. |
| Support (per TradingKey) | ~$266 | Level flagged as the next zone to watch if the $278 area does not hold. |
Table 1: Key levels as of 07:32 UTC (15:32 GMT+8), 13 August 2026. Sources: TradingView, TradingKey. Indicative only.
The moving-average read is worth sitting with. Per the chart header legend, the 50-period average (247.86) still sits below the 200-period average (253.99), a configuration that followed the stock’s slide toward the low-$230s ahead of earnings. Both lines have since turned higher, and a shorter-term average moving back above the longer-term one is typically read as the average catching up to price rather than as a signal on its own. Read those levels as context, not as a script: the ticker AMZN has covered roughly $60 top to bottom this month alone, so a few dollars either side of any of these numbers is well within its current range of motion.
What’s driving AMZN stock
AWS is doing the heavy lifting behind every AMZN earnings headline this quarter. Growth accelerated for a fifth straight quarter to 37% year-on-year, operating margin expanded to roughly 39%, and management flagged an AWS backlog of $496 billion, with AI and chip revenue each running above a $25 billion annualised pace.[1][2] That’s the kind of quarter that makes analysts sit up: growth accelerating and margins expanding at the same time, even as the company spends tens of billions a quarter on AI infrastructure.

On the AMZN stock forecast side, Wall Street’s reaction has tracked the numbers. Morgan Stanley analyst Brian Nowak kept an overweight rating and lifted his 12-month price forecast to $335 from $330, pointing to AWS’s growth-plus-margin combination as the case for a re-rating.[6] J.P. Morgan’s Doug Anmuth held his own price forecast at $325 on continued AWS and AI momentum.[7] Both are describing what they see in the business, not telling anyone what to do with it.
There’s more in AMZN news today than the earnings alone. The FTC’s long-running monopoly case against Amazon is set for trial in October 2026, after a judge let most of the federal and state claims through.[10] On the macro side, July’s Consumer Price Index, out 12 August 2026, rose 0.1% month-on-month and 3.4% year-on-year, with three regional Fed presidents already on record favouring a rate increase at the July meeting.[8][9] None of that is AMZN-specific, but a stock this exposed to AI-infrastructure spending doesn’t trade in a vacuum, and the rate path into September is one more thing sitting in the background.
Risk framing and what to watch
- US CPI (August data), 11 September 2026: the last CPI print before the Fed’s September meeting.[8]
- FOMC rate decision, 16 September 2026: markets are pricing this Federal Reserve meeting as the next test for the rate path after a divided July vote.[9]
- FTC antitrust trial, October 2026: the federal monopoly case against Amazon is scheduled to go to trial this month.[10]
- AMZN’s next earnings date, expected late October 2026: the next scheduled update on AWS growth and capital spending guidance.
On exposure: AMZN has covered close to $60 top to bottom this month, a wide range for any single name to move through in a matter of weeks. Market participants often monitor how far price has travelled from its recent swing highs and lows before sizing a position, and a Stop Loss is one tool for defining that exposure ahead of time rather than reacting to a fast chart in real time.
On position sizing: exposure to AMZN through CFDs typically comes with leverage, and leverage cuts both ways: it scales gains on a favourable move exactly as fast as it scales losses on an unfavourable one. Given how far AMZN has swung this month, position sizing relative to account equity is worth a second look before the next earnings date or the September Fed meeting, rather than left wherever it was set before the rally.
For more Amazon coverage as it happens, the AMZN stock news and earnings news tags track updates on this and other Nasdaq names as they land.
RISK WARNING: CFDs are complex financial instruments and carry a high risk of losing money rapidly due to leverage. You should ensure you fully understand the risks involved and carefully consider whether you can afford to take the high risk of losing your money before trading.
Disclaimer: The information is provided for educational purposes only and doesn’t take into account your personal objectives, financial circumstances, or needs. It does not constitute investment advice. We encourage you to seek independent advice if necessary. The information has not been prepared in accordance with legal requirements designed to promote the independence of investment research. No representation or warranty is given as to the accuracy or completeness of any information contained within. This material may contain historical or past performance figures and should not be relied on. Furthermore estimates, forward-looking statements, and forecasts cannot be guaranteed. The information on this site and the products and services offered are not intended for distribution to any person in any country or jurisdiction where such distribution or use would be contrary to local law or regulation.
References
[1] “Amazon.com Announces Second Quarter Results – SEC EDGAR” https://www.sec.gov/Archives/edgar/data/1018724/000101872426000024/amzn-20260630xex991.htm Accessed on 13 August 2026.
[2] “Amazon (AMZN) Q2 earnings report 2026 – CNBC” https://www.cnbc.com/2026/07/30/amazon-amzn-q2-earnings-report-2026.html Accessed on 13 August 2026.
[3] “Amazon tops $3 trillion market cap as stock continues post-earnings surge – CNBC” https://www.cnbc.com/2026/08/03/amazon-amzn-stock-market-cap-earnings.html Accessed on 13 August 2026.
[4] “AG Davenport Sues Amazon Over Anticompetitive Practices Affecting DSP Delivery Drivers – New Jersey Office of the Attorney General” https://www.njoag.gov/ag-davenport-sues-amazon-over-anticompetitive-practices-affecting-dsp-delivery-drivers/ Accessed on 13 August 2026.
[5] “Bezos to Sell Over $4 Billion in Amazon Stock as Record Rally Faces Pullback Test – TradingKey” https://www.tradingkey.com/analysis/stocks/us-stocks/262072704-us-stock-amazon-amzn-aws-jeff-bezos-ai-tradingkey Accessed on 13 August 2026.
[6] “Morgan Stanley Amazon stock earnings verdict has blind spot – TheStreet” https://www.thestreet.com/investing/stocks/morgan-stanleys-amazon-stock-q2-2026-earnings-verdict-has-a-blind-spot Accessed on 13 August 2026.
[7] “Amazon.Com, Inc. (AMZN) Stock Forecast, Price Targets and Analysts Predictions – TipRanks” https://www.tipranks.com/stocks/amzn/forecast Accessed on 13 August 2026.
[8] “Consumer Price Index – July 2026 – US Bureau of Labor Statistics” https://www.bls.gov/news.release/cpi.nr0.htm Accessed on 13 August 2026.
[9] “CPI, PPI, and FOMC minutes headline a two-week data window – Kraken Blog” https://blog.kraken.com/economic-brief/august-12-2026 Accessed on 13 August 2026.
[10] “Judge rules the FTC can proceed with antitrust lawsuit against Amazon, tosses out few state claims – Barchart” https://www.barchart.com/story/news/28922850/judge-rules-the-ftc-can-proceed-with-antitrust-lawsuit-against-amazon-tosses-out-few-state-claims Accessed on 13 August 2026.
Key Points In This Article

Latest Financial Market News


Market News Tags
- # USD News
- # USDCAD News
- # USDJPY News
- # USDX News
- # Forex News
- # Forex News Today
- # GBPUSD News
- # EURUSD News
- # Currency Trading News
- # AUDUSD news
Related Articles
- US Dollar Index Falls to 98.55 as Yields Ease, Fed Splits
- [DAILY TRADING] Pfizer Stock Price Today 21 August 2026 – $27.82 After CEO’s $1M Share Purchase
- [DAILY TRADING] AUD/USD Analysis 21 August 2026 — AUD/USD Hits 0.7150 as Dollar Slides, Aussie Jobs Miss
- [DAILY TRADING] Nasdaq 100 21 August 2026 – Climbs Back to 29,347 as Wall Street Waits on Jackson Hole
- PLTR Stock Price Today: August 2026 Chart Breakout & Key Levels
- [DAILY TRADING] Oracle Stock 21 August 2026 – ORCL Holds $142 as Pipeline Delay Meets Debt Fears
- [DAILY TRADING]: EUR/USD Analysis 21 August 2026 — EUR/USD Holds 1.1697, Near 3-Month High, ECB Hike Bets Firm
- [DAILY TRADING] Alibaba 21 August 2026 – BABA Stock Price Rebounds to $130.57 After Earnings Miss