
-

-


Download App
-


-

-

-
Search query too short. Please enter a full word or phrase.
-

Keywords
- Forex Trading
- Vantage Rewards
- Spreads
Popular Search
- Trading Accounts
- MT4
- MT5
- Copy Trading
- Promotions





Language

 Market Analysis Daily Analysis [DAILY TRADING] XAUUSD Analysis 5 August 2026: Gold Prints Fresh Highs Near $4,133 as RSI Flags Overbought
Commodities NewsCommodity Market NewsFeatured NewsGold NewsGold News TodayGold Price NewsGold TradingMarket News TodayTechnical analysisTrending NewsVantage NewsXAUUSD News
[DAILY TRADING] XAUUSD Analysis 5 August 2026: Gold Prints Fresh Highs Near $4,133 as RSI Flags Overbought

Vantage Editorial Team >
5 August 2026 | Daily Analysis | 8 min read
Vantage Editorial Team >
Vantage is a global, multi-asset broker with a team of in-house writers and market analysts who produce educational and insightful trading content for traders of all levels.

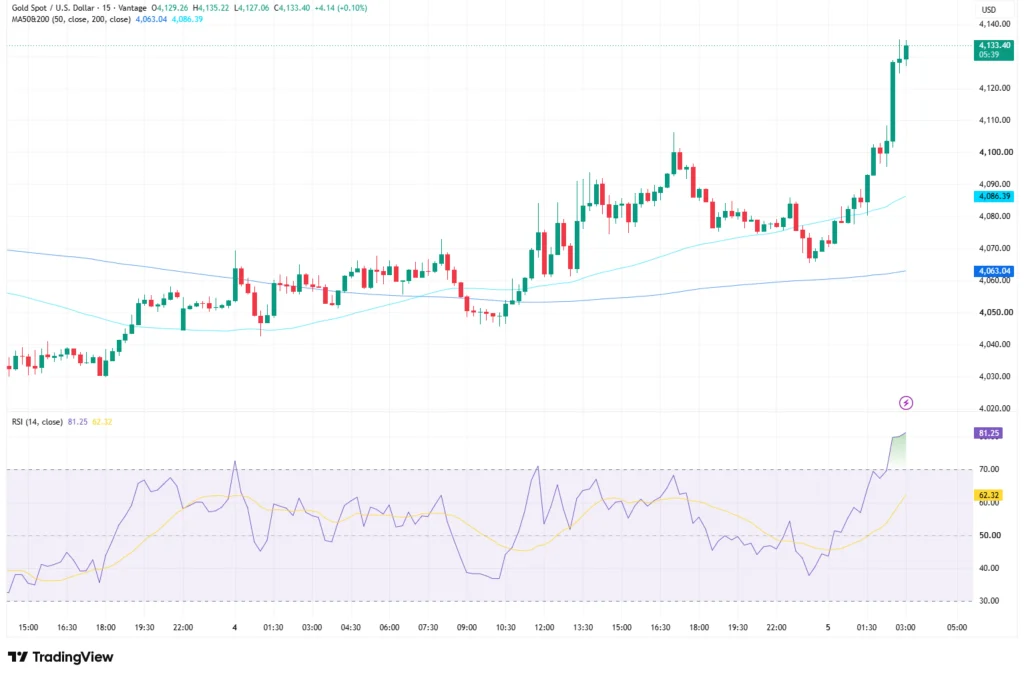
Gold price today: XAUUSD is trading like it forgot the RSI dial only goes to 100. As of 05:39 (GMT+8) on 5 August 2026, the Vantage XAUUSD CFD sits at $4,133.40, up $4.14 on the session (+0.10%), after touching an intraday high of $4,135.22. That caps an overnight run that carried gold prices from the low $4,080s to a fresh session high, right as hopes build that shipping through the Strait of Hormuz will be restored to normal, a headline that has quietly talked down bets on a September Federal Reserve rate hike.
This XAUUSD technical analysis reads what the chart and the gold price news behind it are showing. It does not call the next move, and nothing below is a recommendation to open or close a position.
What The XAUUSD Chart is Showing
Gold chopped in a tight range through the first half of 4 August, dipping to a session low near $4,045 before finding its footing. From there it rallied in two clear legs. The first carried the XAUUSD price to around $4,102, followed by a pullback and a pause near $4,080 for the better part of the evening, as if catching its breath. A second, sharper leg picked things back up late on 4 August and carried gold from about $4,080 to the current $4,133 to $4,135 zone by early Asian trading on 5 August. Not a bad way to spend an overnight session.
The XAUUSD chart now shows price sitting above both the 50-period moving average at $4,063.04 and the 200-period moving average at $4,086.39 on the 15-minute timeframe, a structure that has held for most of the past two days. The Relative Strength Index reads 81.25 on the XAUUSD TradingView setup used for this analysis, well past the 70 line traders usually associate with overbought conditions, while its own moving average trails behind at 62.32. That gap is the chart’s way of saying the current push has run ahead of gold’s own recent pace.
Why Gold Prices Are Climbing Today

Today’s XAUUSD news comes down to one word traders keep repeating: Hormuz. Reports that Qatar has drafted an interim proposal to restore full shipping through the Strait of Hormuz, with both US and Iranian officials said to be signalling progress in talks, have taken some heat out of the inflation story tied to the Middle East conflict.1,2
Traders have responded by trimming the odds of a Federal Reserve rate hike in September to around 57%, down from about 67% a day earlier, according to the CME FedWatch Tool.2 Less tightening on the table means less yield pressure on an asset that pays none of its own, which is one reason gold prices have held above $4,000 through the week, helped along by continued safe haven inflows into gold-backed exchange-traded funds in China.3 In gold news terms, that is a meaningful shift from the more hawkish tone seen earlier in the week.
There is also a calendar to watch. The ADP National Employment Report for July lands later on 5 August, with non-farm payrolls following on 7 August.4 Softer numbers on either release would likely keep today’s tone going. Stronger numbers could just as easily flip it.
XAUUSD Levels and What to Watch Next
The table below covers the zones this analysis is watching. These are reference levels, not trade signals.
| Level | Price | What’s happening |
| Resistance | 4,135.22 / 4,150.00 | Session high; next round-number level above |
| Support | 4,086.39 | 200-period moving average |
| Support | 4,063.04 | 50-period moving average |
| Further support | ~4,045.00 | 4 August session low |
Table 1: Key XAUUSD levels as of 05:39 (GMT+8), 5 August 2026. Source: Vantage XAUUSD CFD, the TradingView setup used for this analysis. Indicative only.
Beyond the chart, the calendar carries the next catalysts. ADP lands later today, non-farm payrolls follow on Friday, and headlines out of the Strait of Hormuz talks are likely to keep nudging both oil and gold intraday.
Risk Considerations
With gold trading near the top of its recent range and RSI stretched into overbought territory, Stop Loss placement relative to the $4,086 to $4,063 support band, and the $4,135 high above, is worth a second look today. A Stop Loss limits losses to a planned size; it does not prevent one outright, and none of this is a signal to open or close a position.
Leverage is a double-edged tool, full stop. It magnifies gains just as easily as losses, so position sizing relative to account equity is worth revisiting ahead of the ADP release and Friday’s payrolls print, especially with gold moving this much on headlines alone this week.
RISK WARNING: CFDs are complex financial instruments and carry a high risk of losing money rapidly due to leverage. You should ensure you fully understand the risks involved and carefully consider whether you can afford to take the high risk of losing your money before trading.
Disclaimer: The information is provided for educational purposes only and doesn’t take into account your personal objectives, financial circumstances, or needs. It does not constitute investment advice. We encourage you to seek independent advice if necessary. The information has not been prepared in accordance with legal requirements designed to promote the independence of investment research. No representation or warranty is given as to the accuracy or completeness of any information contained within. This material may contain historical or past performance figures and should not be relied on. Furthermore estimates, forward-looking statements, and forecasts cannot be guaranteed. The information on this site and the products and services offered are not intended for distribution to any person in any country or jurisdiction where such distribution or use would be contrary to local law or regulation.
References
[1] “Gold Holds Steady as Progress on Hormuz Trims Rate-Hike Bets – Bloomberg” https://www.bloomberg.com/news/articles/2026-08-04/gold-holds-steady-as-progress-on-hormuz-trims-rate-hike-bets Accessed on 5 August 2026.
[2] “Gold recovers as Hormuz reopening hopes drag US Dollar, Oil prices lower – FXStreet” https://www.fxstreet.com/news/gold-recovers-as-hormuz-reopening-hopes-drag-us-dollar-oil-prices-lower-202608041427 Accessed on 5 August 2026.
[3] “Gold – Price – Chart – Historical Data – News – Trading Economics” https://tradingeconomics.com/commodity/gold Accessed on 5 August 2026.
[4] “ADP National Employment Report – ADP Research” https://mediacenter.adp.com/2026-07-01-ADP-National-Employment-Report-Private-Sector-Employment-Increased-by-98,000-Jobs-in-June-Annual-Pay-was-Up-4-4 Accessed on 5 August 2026.
Key Points In This Article

Latest Financial Market News


Market News Tags
- # USD News
- # USDCAD News
- # USDJPY News
- # USDX News
- # Forex News
- # Forex News Today
- # GBPUSD News
- # EURUSD News
- # Currency Trading News
- # AUDUSD news
Related Articles
- US Dollar Index Falls to 98.55 as Yields Ease, Fed Splits
- [DAILY TRADING] Pfizer Stock Price Today 21 August 2026 – $27.82 After CEO’s $1M Share Purchase
- [DAILY TRADING] AUD/USD Analysis 21 August 2026 — AUD/USD Hits 0.7150 as Dollar Slides, Aussie Jobs Miss
- [DAILY TRADING] Nasdaq 100 21 August 2026 – Climbs Back to 29,347 as Wall Street Waits on Jackson Hole
- PLTR Stock Price Today: August 2026 Chart Breakout & Key Levels
- [DAILY TRADING] Oracle Stock 21 August 2026 – ORCL Holds $142 as Pipeline Delay Meets Debt Fears
- [DAILY TRADING]: EUR/USD Analysis 21 August 2026 — EUR/USD Holds 1.1697, Near 3-Month High, ECB Hike Bets Firm
- [DAILY TRADING] Alibaba 21 August 2026 – BABA Stock Price Rebounds to $130.57 After Earnings Miss