
-

-


Download App
-


-

-

-
Search query too short. Please enter a full word or phrase.
-

Keywords
- Forex Trading
- Vantage Rewards
- Spreads
Popular Search
- Trading Accounts
- MT4
- MT5
- Copy Trading
- Promotions





Language


EURUSD NewsFeatured NewsFederal Reserve NewsForex NewsIndices NewsInterest Rate NewsMarket News TodayNFP NewsTechnical analysisTrending NewsUSDJPY NewsUSDX NewsVantage News
US Dollar Index (DXY) Forecast: Worst Week in Three Months

Vantage Editorial Team >
3 August 2026 | Market Analysis | 11 min read
Vantage Editorial Team >
Vantage is a global, multi-asset broker with a team of in-house writers and market analysts who produce educational and insightful trading content for traders of all levels.
Three weeks of grinding higher. Four days of giving almost all of it back. That is the US Dollar Index in a nutshell right now, and if you looked away for a week, you missed a genuinely wild one.
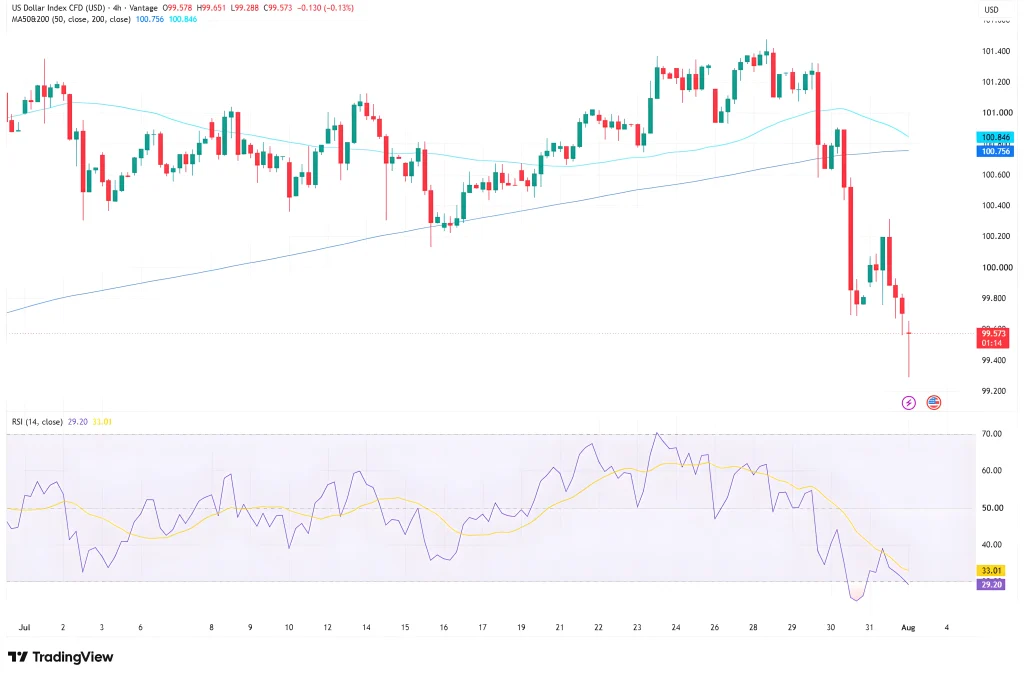
The Vantage US Dollar Index CFD sits at 99.573 as of 09:58 (GMT+8) on 3 August 2026, a touch softer on the day.1 That figure actually understates the move. The index closed last week near 100.3, already its worst weekly performance in three months, then extended the slide into this week, gapping down to an intraday low of 99.288 in the Monday Asian session before paring some of that drop.1 Add a fifth straight Fed hold and a sudden yen intervention, and it has been a messy few sessions for the dollar.
This USDX chart update walks through the four-hour dollar index chart, why the Fed’s decision split the way it did, and the levels worth watching on the DXY index and two related pairs. All prices are as of the cut-off above, charts are from TradingView, and none of this is financial advice.
What the dollar index chart is actually showing
For the first three weeks of July, the US dollar index climbed in a fairly orderly way, from around 100.00 to a fresh high near 101.50 struck around 23 to 24 July, helped along by firmer Treasury yields and a run of resilient US data, a peak last week’s USDX update was already tracking. It looked, for a while, like a genuine trend. Then it wasn’t.
From 29 July, the dollar index chart turned lower and did not really stop. It shed roughly a point and a half last week to close near 100.3 on Friday, a fresh three-month worst. Then it gapped down further as the new week opened, printing an intraday low of 99.288 in the Monday Asian session before paring the drop back to the current 99.573. That is not a gentle pullback. That is a chart that changed its mind in a hurry, and it is still moving.
The move flipped the technical picture on its head. The 50-period moving average now sits at 100.756 and the 200-period average at 100.846, both sitting comfortably above the current 99.573 close. Through the back half of July, those averages were tracking as the floor under price. They are now acting as a ceiling, and the index would need to climb back through both before anyone could call the July uptrend intact again.
Momentum tells the same story. The TradingView setup used for this analysis puts the 14-period Relative Strength Index at 29.20, with its signal line at 33.01, meaning the dollar index chart touched oversold territory below 30 during the sell-off and has only partly recovered since. An oversold RSI reading is not a crystal ball. It is, at minimum, a sign that the drop moved fast enough to stretch short-term positioning, which is likely why the dollar index today found some support just above 99.30 rather than falling further.
A fifth straight hold, and a Fed that is anything but united
The Federal Reserve left its benchmark rate unchanged at 3.50% to 3.75% on 29 July 2026, after two days of deliberation.2,6 That made it the fifth consecutive hold, and the second policy meeting under Chair Kevin Warsh.8 The vote itself was closer than the headline suggests, 9 to 3.2 Cleveland’s Beth Hammack, Minneapolis’s Neel Kashkari and Dallas’s Lorie Logan all dissented in favour of a quarter-point increase, as the Middle East conflict kept inflation risk elevated heading into the vote.7
Warsh has said he wanted this kind of open disagreement, framing it as healthy rather than a sign the committee is fracturing.7 J.P. Morgan Wealth Management strategists said afterwards they still expect the Fed to stay on hold for the rest of 2026.8 The Fed’s next scheduled meeting falls on 15 to 16 September, with Warsh expected to speak at the Jackson Hole symposium beforehand.3 Markets have already adjusted: pricing now points to roughly a two-thirds probability of a quarter-point increase at that September meeting, a sharp turnaround from earlier in the year, when rate cuts were the base case under discussion.1
The next big swing factor lands on 7 August 2026, when the Bureau of Labor Statistics publishes the July employment report.4 June’s reading added just 57,000 jobs to nonfarm payrolls, roughly half the median forecast in a Bloomberg survey and a noticeable slowdown from the average pace of gains earlier in the year.5 A soft July print would complicate the case for a September hike. A strong one would reinforce it. Either way, this single release may carry more weight for the US dollar index than anything else on the calendar this month.
A yen intervention added a second shock, right on cue
As if the Fed wasn’t enough, the dollar fell as much as 3.3% against the Japanese yen in a single session on 30 July, in a move consistent with the Bank of Japan stepping back into the market.1 US Treasury Secretary Scott Bessent said afterwards that the yen looked too weak and that sharp currency swings help nobody.1
For the dollar index, the timing could not have been messier. The yen carries the second-largest weight in the DXY basket after the euro, so a fast move in USDJPY shows up almost immediately in the index. Combined with the Fed’s hold, it added to a broader repricing of dollar positioning that pulled the index through both moving averages inside a single week, rather than the slower drift the chart had been suggesting through most of July.
Levels to watch on the DXY index and related pairs
The table below covers the zones traders are watching across the dollar index and two of its most-traded related pairs. Treat these as reference points, not instructions.
| Pair | Support | Resistance | What’s happening |
| DXY | 99.30 | 100.75 / 100.85 | Trading near 99.57, testing the low struck in this week’s opening gap |
| EURUSD | 1.1400 | 1.1650 | Firmer since the Fed’s hold, testing familiar resistance |
| USDJPY | 155.00 | 160.00 | Fell sharply on suspected Bank of Japan intervention |
Table 1: Key levels as of 09:58 (GMT+8), 3 August 2026. Sources: Vantage CFD feed, TradingEconomics. Indicative only.
DXY is holding just above the 99.30 area struck in this week’s opening gap, with the 50- and 200-period moving averages now sitting overhead as resistance rather than support. EURUSD has firmed modestly since the Fed’s hold and continues to test resistance in familiar territory, though the specific levels here are broker-indicative rather than tied to one dated print. USDJPY remains the most reactive pair of the bunch after last week’s intervention, and any fresh yen strength would likely weigh on the broader dollar index given its basket weighting, where it ranks as the second-largest component after the euro.
Volatility this week has been unusual, with intraday ranges on both the dollar index and USDJPY running well above their recent averages. Stop Loss placement matters more than usual in conditions like this, and the level should reflect what a position can withstand rather than just where the chart happens to look tidy. Anyone holding dollar-linked exposure alongside yen or euro positions might also want to check the combined size of that exposure, since a fast move in one can now spill quickly into the others.
Leverage remains a double-edged tool in a week like this one, magnifying a loss just as easily as a gain, particularly when price is punching through key levels the way the dollar index has this week. Position sizing relative to account equity is worth a second look ahead of the July jobs report on 7 August, given how much the next move in the US dollar index may hinge on that single number.
RISK WARNING: CFDs are complex financial instruments and carry a high risk of losing money rapidly due to leverage. You should ensure you fully understand the risks involved and carefully consider whether you can afford to take the high risk of losing your money before trading.
Disclaimer: The information is provided for educational purposes only and doesn’t take into account your personal objectives, financial circumstances, or needs. It does not constitute investment advice. We encourage you to seek independent advice if necessary. The information has not been prepared in accordance with legal requirements designed to promote the independence of investment research. No representation or warranty is given as to the accuracy or completeness of any information contained within. This material may contain historical or past performance figures and should not be relied on. Furthermore estimates, forward-looking statements, and forecasts cannot be guaranteed. The information on this site and the products and services offered are not intended for distribution to any person in any country or jurisdiction where such distribution or use would be contrary to local law or regulation.
References
1. “United States Dollar – Quote – Chart – Historical Data – News – TradingEconomics” https://tradingeconomics.com/united-states/currency Accessed on 03 August 2026.
2. “Fed rate decision July 2026: Divided Fed holds interest rates steady – CNBC” https://www.cnbc.com/2026/07/29/fed-rate-decision-july-2026.html Accessed on 03 August 2026.
3. “July FOMC: Fed holds interest rates steady – Fox Business” https://www.foxbusiness.com/economy/federal-reserve-interest-rate-decision-july-29-2026 Accessed on 03 August 2026.
4. “Employment Situation Summary – US Bureau of Labor Statistics” https://www.bls.gov/news.release/empsit.nr0.htm Accessed on 03 August 2026.
5. “July 2026 US Jobs Report – Staffing Industry Analysts” https://www.staffingindustry.com/research/research-reports/americas/july-2026-us-jobs-report Accessed on 03 August 2026.
6. “Fed, in a nail-biter July meeting, decides to leave rates unchanged – Fortune” https://fortune.com/2026/07/29/federal-reserve-july-decision-unchanged-kevin-warsh/ Accessed on 03 August 2026.
7. “Two key takeaways from the Fed’s unusually unpredictable meeting – CNN Business” https://edition.cnn.com/2026/07/29/economy/fed-rate-decision-july Accessed on 03 August 2026.
8. “Kevin Warsh Says Fed Will ‘Deliver Price Stability’ After Decision to Hold Rates at July Meeting – Chase” https://www.chase.com/personal/investments/learning-and-insights/article/kevin-warsh-july-2026-federal-reserve-will-deliver-price-stability Accessed on 03 August 2026.
Key Points In This Article

Latest Financial Market News


Market News Tags
- # USD News
- # USDCAD News
- # USDJPY News
- # USDX News
- # Forex News
- # Forex News Today
- # GBPUSD News
- # EURUSD News
- # Currency Trading News
- # AUDUSD news
Related Articles
- US Dollar Index Falls to 98.55 as Yields Ease, Fed Splits
- [DAILY TRADING] Pfizer Stock Price Today 21 August 2026 – $27.82 After CEO’s $1M Share Purchase
- [DAILY TRADING] AUD/USD Analysis 21 August 2026 — AUD/USD Hits 0.7150 as Dollar Slides, Aussie Jobs Miss
- [DAILY TRADING] Nasdaq 100 21 August 2026 – Climbs Back to 29,347 as Wall Street Waits on Jackson Hole
- PLTR Stock Price Today: August 2026 Chart Breakout & Key Levels
- [DAILY TRADING] Oracle Stock 21 August 2026 – ORCL Holds $142 as Pipeline Delay Meets Debt Fears
- [DAILY TRADING]: EUR/USD Analysis 21 August 2026 — EUR/USD Holds 1.1697, Near 3-Month High, ECB Hike Bets Firm
- [DAILY TRADING] Alibaba 21 August 2026 – BABA Stock Price Rebounds to $130.57 After Earnings Miss