
-

-


Download App
-


-

-

-
Search query too short. Please enter a full word or phrase.
-

Keywords
- Forex Trading
- Vantage Rewards
- Spreads
Popular Search
- Trading Accounts
- MT4
- MT5
- Copy Trading
- Promotions





Language

 Market Analysis Daily Analysis [DAILY TRADING] S&P 500 Analysis 10 August 2026 – Index Extends Record Run Into a Big Data Week
CPI NewsEconomic News TodayFeatured NewsFederal Reserve NewsInterest Rate NewsIran NewsMarket News TodayNFP NewsStock Market NewsStock Market News TodayTechnical analysisTrending NewsVantage News
[DAILY TRADING] S&P 500 Analysis 10 August 2026 – Index Extends Record Run Into a Big Data Week

Vantage Editorial Team >
10 August 2026 | Daily Analysis | 9 min read
Vantage Editorial Team >
Vantage is a global, multi-asset broker with a team of in-house writers and market analysts who produce educational and insightful trading content for traders of all levels.
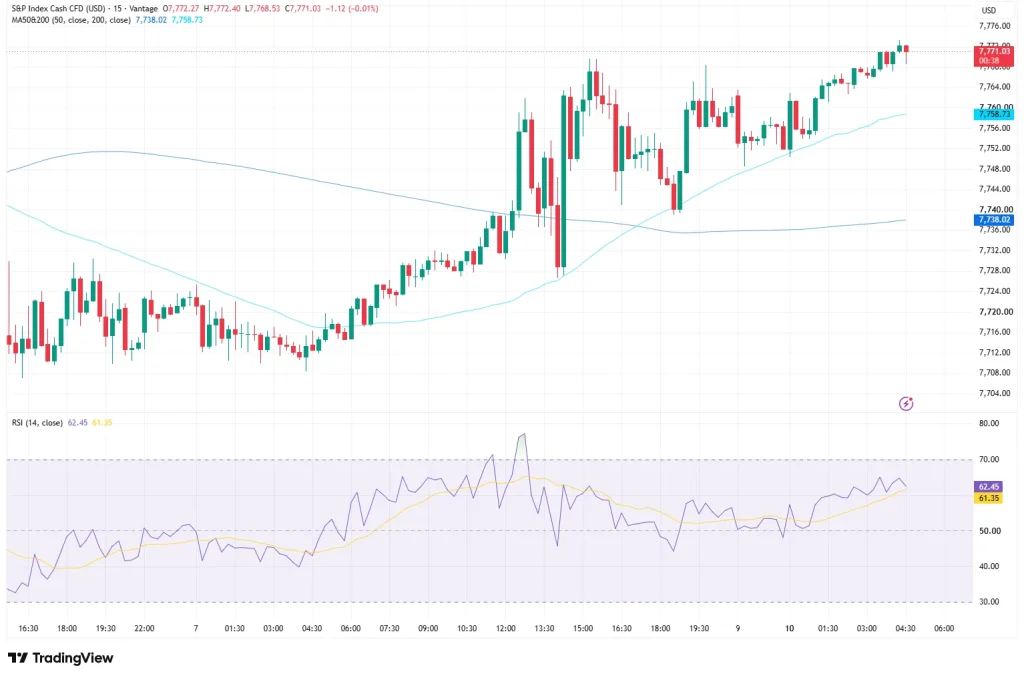
The SP500 today trades near 7,771 as of the 00:38 ET (04:38 GMT / 12:38 GMT+8) cut-off on 10 August 2026, holding just above the record close of 7,757.64 the index printed last Friday 1. It’s been a stubborn rally, with barely a dent in the advance despite two major inflation prints landing this week. Every level below sits at that cut-off and is for informational purposes only.
What the SP500 Chart is Showing
Rewind to early last week and the SP500 index was doing very little, chopping between 7,708 and 7,720 for the better part of two sessions. Then buyers showed up on Friday, spiking the index to roughly 7,775 before it gave back ground into the 7,757.64 close, a net gain of about 50 points from Thursday’s low. That advance has carried into the new week: the TradingView setup used for this analysis shows an intraday high of 7,772.40 and a low of 7,768.53 in the most recent session.
Under the hood, the 50-period moving average has climbed to 7,738.02 and is closing the gap with the 200-period average at 7,758.73, a setup technical traders sometimes flag as an early golden cross. Price has held above both since Friday. RSI(14) sits at 62.45 against a signal average of 61.35, per the TradingView setup used for this analysis: firmly out of oversold territory, off Friday’s spike above 70, and back on the front foot without looking stretched.
The Bigger Picture Behind the SP500 Price

Friday’s record close capped the SP500’s best weekly performance since April 5, and it came from an unlikely source: a weak jobs report. Nonfarm payrolls for July fell by 23,000, well short of the roughly 83,000 gain economists had expected, while the unemployment rate eased to 4.1% 2. Wage growth cooled too, with average hourly earnings up just 3.2% year on year, the slowest pace since May 2021 2. Soft data like that usually reads as a green light for the Federal Reserve to sit tight.
Except the Fed is not entirely on the same page: last week’s FOMC vote to hold rates passed 9-3 3, with several officials pointing to the Middle East conflict and a boom in AI-related investment spending as reasons a September hike may still be needed 4. CME FedWatch data cited on 6 August put the odds of that move at 58.9% 6. Hopes for a deal restoring free passage through the Strait of Hormuz had already fuelled a string of record closes earlier last week 4, though a report on 9 August flagged growing doubts after Iran’s foreign minister denied being in direct talks with the US 5. The SP500’s calm exterior, in other words, is masking a genuinely mixed picture underneath.
Two data points will test that calm directly. US CPI for July lands on 12 August at 8:30am ET 7, with PPI following a day later on 13 August at the same time 8. Between them, they are the closest thing to a referendum on whether the Fed’s hold survives into September.
SP500 Levels and Risk Considerations
On the charts, resistance does not sit far above the current SP500 price, with the session high near 7,772 the immediate ceiling and 7,800 the next psychological line above that. Support runs in layers: first the 200-period average at 7,758.73, then the 50-period average at 7,738.02, and further down near 7,708, where last week’s base was built.
Leverage on an SP500 CFD scales both potential gains and potential losses, so position sizing relative to account equity is worth a second look heading into a week with two inflation prints on the calendar. Stop Loss placement around the levels above can help manage that exposure, though it does not remove the risk of loss entirely.
What to Watch Next
- CPI, 12 August 2026: US Consumer Price Index for July, due 8:30am ET (8:30pm GMT+8). Markets are watching for confirmation that the recent disinflation trend continues.
- PPI, 13 August 2026: US Producer Price Index for July, due 8:30am ET (8:30pm GMT+8), a day after CPI.
- Strait of Hormuz talks, ongoing: any credible update on progress toward restoring free passage through the waterway remains a swing factor for energy prices and, by extension, the inflation outlook priced into equities.
Closing
Volatility around Wednesday’s and Thursday’s inflation data could widen intraday ranges on the SP500 Cash CFD beyond what the past week has shown. Traders holding positions through both releases may want to revisit Stop Loss placement relative to the 7,758 and 7,738 support levels, and to consider that correlated exposure across US equity indices, gold, or the dollar can move together in a fast, data-driven session.
Leverage remains a double-edged tool: it scales returns just as readily as it scales losses, and it does so in both directions at once. Position sizing relative to account equity, rather than relative to conviction about the CPI or PPI outcome, is worth revisiting ahead of Wednesday’s release.
RISK WARNING: CFDs are complex financial instruments and carry a high risk of losing money rapidly due to leverage. You should ensure you fully understand the risks involved and carefully consider whether you can afford to take the high risk of losing your money before trading.
Disclaimer: The information is provided for educational purposes only and doesn’t take into account your personal objectives, financial circumstances, or needs. It does not constitute investment advice. We encourage you to seek independent advice if necessary. The information has not been prepared in accordance with legal requirements designed to promote the independence of investment research. No representation or warranty is given as to the accuracy or completeness of any information contained within. This material may contain historical or past performance figures and should not be relied on. Furthermore estimates, forward-looking statements, and forecasts cannot be guaranteed. The information on this site and the products and services offered are not intended for distribution to any person in any country or jurisdiction where such distribution or use would be contrary to local law or regulation.
References
[1] “S&P 500 (SP500) – FRED, Federal Reserve Bank of St. Louis” https://fred.stlouisfed.org/series/SP500 Accessed on 10 August 2026.
[2] “Employment Situation Summary – July 2026 – U.S. Bureau of Labor Statistics” https://www.bls.gov/news.release/empsit.nr0.htm Accessed on 10 August 2026.
[3] “July jobs report shows unexpected payroll loss – CNBC” https://www.cnbc.com/2026/08/07/jobs-report-july-2026.html Accessed on 10 August 2026.
[4] “S&P 500 Rises to All-Time High on Hormuz Deal Push: Markets Wrap – Bloomberg via Swissinfo” https://swissinfo.ch/eng/s&p-500-rises-to-all-time-high-on-hormuz-deal-push:-markets-wrap/91841475 Accessed on 10 August 2026.
[5] “S&P 500 futures slip as traders watch for Strait of Hormuz deal, inflation data – CNBC” https://www.cnbc.com/2026/08/09/stock-market-today-live-updates.html Accessed on 10 August 2026.
[6] “Stock Market Today: S&P 500, Dow Futures Gain After Scott Bessent Signals Strait of Hormuz Deal With Iran – Benzinga” https://www.benzinga.com/markets/equities/26/08/60939272/stock-market-today-sp-500-dow-futures-gain-after-scott-bessent-signals-strait-of-hormuz-deal-with-iran-in-sight-amd-spacex-sandisk-in-focus Accessed on 10 August 2026.
[7] “Consumer Price Index News Release – U.S. Bureau of Labor Statistics” https://www.bls.gov/news.release/cpi.htm Accessed on 10 August 2026.
[8] “Producer Price Index Home – U.S. Bureau of Labor Statistics” https://www.bls.gov/ppi/ Accessed on 10 August 2026.
Key Points In This Article

Latest Financial Market News


Market News Tags
- # USD News
- # USDCAD News
- # USDJPY News
- # USDX News
- # Forex News
- # Forex News Today
- # GBPUSD News
- # EURUSD News
- # Currency Trading News
- # AUDUSD news
Related Articles
- US Dollar Index Falls to 98.55 as Yields Ease, Fed Splits
- [DAILY TRADING] Pfizer Stock Price Today 21 August 2026 – $27.82 After CEO’s $1M Share Purchase
- [DAILY TRADING] AUD/USD Analysis 21 August 2026 — AUD/USD Hits 0.7150 as Dollar Slides, Aussie Jobs Miss
- [DAILY TRADING] Nasdaq 100 21 August 2026 – Climbs Back to 29,347 as Wall Street Waits on Jackson Hole
- PLTR Stock Price Today: August 2026 Chart Breakout & Key Levels
- [DAILY TRADING] Oracle Stock 21 August 2026 – ORCL Holds $142 as Pipeline Delay Meets Debt Fears
- [DAILY TRADING]: EUR/USD Analysis 21 August 2026 — EUR/USD Holds 1.1697, Near 3-Month High, ECB Hike Bets Firm
- [DAILY TRADING] Alibaba 21 August 2026 – BABA Stock Price Rebounds to $130.57 After Earnings Miss