
-

-


Download App
-


-

-

-
Search query too short. Please enter a full word or phrase.
-

Keywords
- Forex Trading
- Vantage Rewards
- Spreads
Popular Search
- Trading Accounts
- MT4
- MT5
- Copy Trading
- Promotions





Language

 Market Analysis Daily Analysis [DAILY TRADING] SP500 Analysis 17 August 2026: SP500 Today Climbs to 7,808 as Earnings Beat and Averages Converge
CPI NewsFeatured NewsFederal Reserve NewsMarket News TodaySP500 NewsStock Market NewsStock Market News TodayTechnical analysisTrending NewsUSD NewsVantage News
[DAILY TRADING] SP500 Analysis 17 August 2026: SP500 Today Climbs to 7,808 as Earnings Beat and Averages Converge

Vantage Editorial Team >
17 August 2026 | Daily Analysis | 9 min read
Vantage Editorial Team >
Vantage is a global, multi-asset broker with a team of in-house writers and market analysts who produce educational and insightful trading content for traders of all levels.

Well, the SP500 clearly did not get the memo that Fridays are supposed to be quiet. As of 15:54 (GMT+8) on 17 August 2026, the Vantage SP500 CFD traded at 7,806.38, already back above last week’s record close of 7,798.99, though still shy of that session’s intraday peak near 7,825.1 Here is what the SP500 chart is actually showing, the SP500 price levels worth watching, and the earnings and rate-path story sitting underneath today’s SP500 news.
What the SP500 Chart Is Showing Right Now
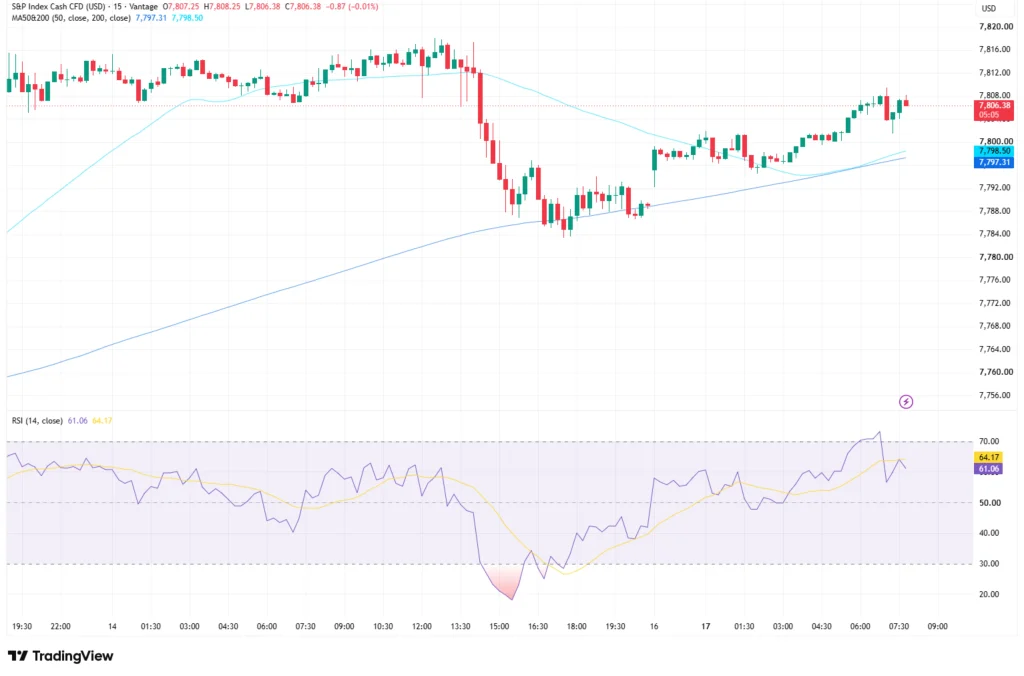
On the 15-minute SP500 chart, Thursday was almost sleepy: price held a tight 7,805 to 7,816 band. Friday had other plans. A sharp slide dragged the SP500 index down to roughly 7,784 to 7,788, and the RSI (14) dropped to about 20 on the TradingView setup used for this analysis, properly oversold for the first time all week.
Since the Sunday reopen, the SP500 stock price has clawed its way back through 7,800 and now sits at 7,806.38, almost exactly on top of its 50-period moving average (7,797.31) and 200-period moving average (7,798.50). Both averages have converged into the same pivot zone the index keeps testing. The RSI has bounced back to 61.06, with its signal line at 64.17, both comfortably back in neutral-to-firm territory.
Unlike a passive SP500 index funds strategy, the Vantage SP500 CFD tracks the S&P 500 index in real time, worth noting on a day the index has round-tripped this far this fast.
The SP500 Levels in Play
The table below sets out today’s reference zone for the SP500 CFD. These are levels traders are monitoring, not trade signals.
| Instrument | Support | Resistance | What’s Happening |
| S&P 500 CFD (US500) | 7,784 / 7,788 | 7,812 / 7,816 | Recovering toward last week’s record high; MA50 and MA200 have converged near 7,797 to 7,798. |
Table 1: Reference levels for the Vantage SP500 CFD as of 15:54 (GMT+8), 17 August 2026. Source: the TradingView setup used for this analysis. Indicative only, not trade signals.
Behind the Rebound: Earnings, the Fed, and a Softer Dollar
Credit where it is due: earnings season is doing a lot of the heavy lifting here. With around 90% of S&P 500 constituents having reported, year-over-year profit growth is running near 32%, among the strongest quarters on record according to Bloomberg-sourced data.3 That is the kind of number that makes a Friday wobble look like noise.
The S&P 500 index today is still digesting Thursday’s fresh record, a 0.7% climb on cooler inflation data and softer oil.1 Friday clawed some of that back, down about 0.2% as a preliminary University of Michigan sentiment reading and a soft Census Bureau retail sales print gave traders pause, though the index still closed out a third straight weekly gain.2
The Cboe Volatility Index has eased to fresh 2026 lows near 14, though the Federal Reserve’s Jackson Hole symposium on 27 to 29 August is the next scheduled event that could stir things up.4 Monday’s tone has leaned constructive: SP500 futures ticked up around 0.11% into the open, prediction markets priced roughly a 62% chance of a higher session, and a softer US dollar followed reduced bets on a Fed rate hike next month.5,6
What’s on Deck for the SP500 This Week
- Retail Earnings, This Week: Target and Walmart report ahead of Nvidia’s results on 26 August, a read on consumer spending and AI-linked demand.5
- Jackson Hole Symposium, 27 to 29 August 2026: the Fed’s annual gathering, the next scheduled catalyst for rate expectations.4
- VIX Positioning: near 2026 lows, leaving less cushion if sentiment turns.4
- US Dollar Index: a softer dollar has tracked reduced near-term Fed rate-move odds this week, worth watching alongside equities.6
Managing Risk Around This Range
A round trip from 7,816 to 7,784 and most of the way back in a handful of sessions is a decent reminder that the SP500 price can move fast around data releases and Fed headlines. Stop Loss placement around the 7,784 to 7,788 support zone, or the 7,812 to 7,816 resistance zone, is worth a second look given how quickly this range has been tested in both directions this week.
Leverage cuts both ways here: it can amplify a loss just as easily as a gain, so position sizing relative to account equity deserves attention ahead of Jackson Hole and this week’s retail earnings. The Risk Management hub covers both in more depth, and the SP500 trading guide is a solid primer if you are new to reading SP500 performance on a chart. For live pricing, check the SP500 CFD page, catch up on Thursday’s record breakout in our previous SP500 today coverage, and follow the latest SP500 news for updates through the week. And for the macro backdrop behind the Federal Reserve’s next move, keep Jackson Hole on your calendar.
RISK WARNING: CFDs are complex financial instruments and carry a high risk of losing money rapidly due to leverage. You should ensure you fully understand the risks involved and carefully consider whether you can afford to take the high risk of losing your money before trading.
Disclaimer: The information is provided for educational purposes only and doesn’t take into account your personal objectives, financial circumstances, or needs. It does not constitute investment advice. We encourage you to seek independent advice if necessary. The information has not been prepared in accordance with legal requirements designed to promote the independence of investment research. No representation or warranty is given as to the accuracy or completeness of any information contained within. This material may contain historical or past performance figures and should not be relied on. Furthermore estimates, forward-looking statements, and forecasts cannot be guaranteed. The information on this site and the products and services offered are not intended for distribution to any person in any country or jurisdiction where such distribution or use would be contrary to local law or regulation.
References
[1] “How Major US Stock Indexes Fared Thursday 8/13/2026 – The Washington Post” https://www.washingtonpost.com/business/2026/08/13/wall-street-stocks-dow-nasdaq/c1b80e16-9754-11f1-9ef9-1be722184483_story.html Accessed on 17 August 2026.
[2] “Stock Market Today: S&P 500 Slips From Record High but Caps Third Straight Week of Gains – Yahoo Finance” https://finance.yahoo.com/markets/live/stock-market-today-friday-august-14-dow-sp-500-nasdaq-102635519.html Accessed on 17 August 2026.
[3] “Weekly Market Update August 17 2026 – ATB Financial” https://www.atb.com/wealth/good-advice/markets/weekly-market-update-august-17-2026/ Accessed on 17 August 2026.
[4] “Retail Sales Take a Dip, Stocks Eye Weekly Gain – Charles Schwab” https://www.schwab.com/learn/story/stock-market-update-open Accessed on 17 August 2026.
[5] “Stock Market: Will S&P 500 Open Up or Down Today? – Benzinga” https://www.benzinga.com/markets/prediction-markets/26/08/61238641/stock-market-will-sp-500-open-up-or-down-today-17 Accessed on 17 August 2026.
[6] “Stock Market Today: Dow, S&P Live Updates for August 17 – Bloomberg” https://www.bloomberg.com/news/articles/2026-08-16/stock-market-today-dow-s-p-live-updates Accessed on 17 August 2026.
[7] “S&P 500 (SP500) – FRED, Federal Reserve Bank of St. Louis” https://fred.stlouisfed.org/series/SP500 Accessed on 17 August 2026.
[8] “S&P 500 Closes at a New Record, Buoyed by Cooler-Than-Expected Inflation Data and Falling Oil Prices – CNBC” https://www.cnbc.com/2026/08/12/stock-market-today-live-updates.html Accessed on 17 August 2026.
[9] “SP500 Today: Tops 7,800 as Inflation Cools, Oil Slides – Vantage Markets” https://vantagemarektsdev.canglankeji.com/market-analysis/sp500-today-tops-7800-inflation-cools-oil-slides-august-14-2026/ Accessed on 17 August 2026.
Key Points In This Article

Latest Financial Market News


Market News Tags
- # USD News
- # USDCAD News
- # USDJPY News
- # USDX News
- # Forex News
- # Forex News Today
- # GBPUSD News
- # EURUSD News
- # Currency Trading News
- # AUDUSD news
Related Articles
- US Dollar Index Falls to 98.55 as Yields Ease, Fed Splits
- [DAILY TRADING] Pfizer Stock Price Today 21 August 2026 – $27.82 After CEO’s $1M Share Purchase
- [DAILY TRADING] AUD/USD Analysis 21 August 2026 — AUD/USD Hits 0.7150 as Dollar Slides, Aussie Jobs Miss
- [DAILY TRADING] Nasdaq 100 21 August 2026 – Climbs Back to 29,347 as Wall Street Waits on Jackson Hole
- PLTR Stock Price Today: August 2026 Chart Breakout & Key Levels
- [DAILY TRADING] Oracle Stock 21 August 2026 – ORCL Holds $142 as Pipeline Delay Meets Debt Fears
- [DAILY TRADING]: EUR/USD Analysis 21 August 2026 — EUR/USD Holds 1.1697, Near 3-Month High, ECB Hike Bets Firm
- [DAILY TRADING] Alibaba 21 August 2026 – BABA Stock Price Rebounds to $130.57 After Earnings Miss