
-

-


Download App
-


-

-

-
Search query too short. Please enter a full word or phrase.
-

Keywords
- Forex Trading
- Vantage Rewards
- Spreads
Popular Search
- Trading Accounts
- MT4
- MT5
- Copy Trading
- Promotions





Language

 Market Analysis Daily Analysis [DAILY TRADING] SP500 Analysis 4 August 2026: Wall Street’s Rally Meets an AI Reality Check
Amazon Stock NewsDJ30 NewsEarnings News TodayFeatured NewsFinancial NewsGoogle Stock NewsMarket News TodayMeta NewsMicrosoft NewsNasdaq News TodayNVIDIA NewsSP500 NewsStock Market NewsStock Market News TodayTechnical analysisTrending NewsVantage News
[DAILY TRADING] SP500 Analysis 4 August 2026: Wall Street’s Rally Meets an AI Reality Check

Vantage Editorial Team >
4 August 2026 | Daily Analysis | 7 min read
Vantage Editorial Team >
Vantage is a global, multi-asset broker with a team of in-house writers and market analysts who produce educational and insightful trading content for traders of all levels.

The SP500 index is having one of those mornings where the chart and the mood in the room don’t quite agree. The Vantage SP500 CFD traded at 7,625.55 as of 01:53 (GMT+0) on 4 August 2026, holding firmly above both its 50 and 200-period moving averages after Monday’s strong Wall Street close. The SP500 price barely moved in the last 15 minutes before the cut-off, pausing to catch its breath. This piece reads the SP500 chart and the wires as they stand right now. It does not call a trade.
What the SP500 Chart Is Showing Today
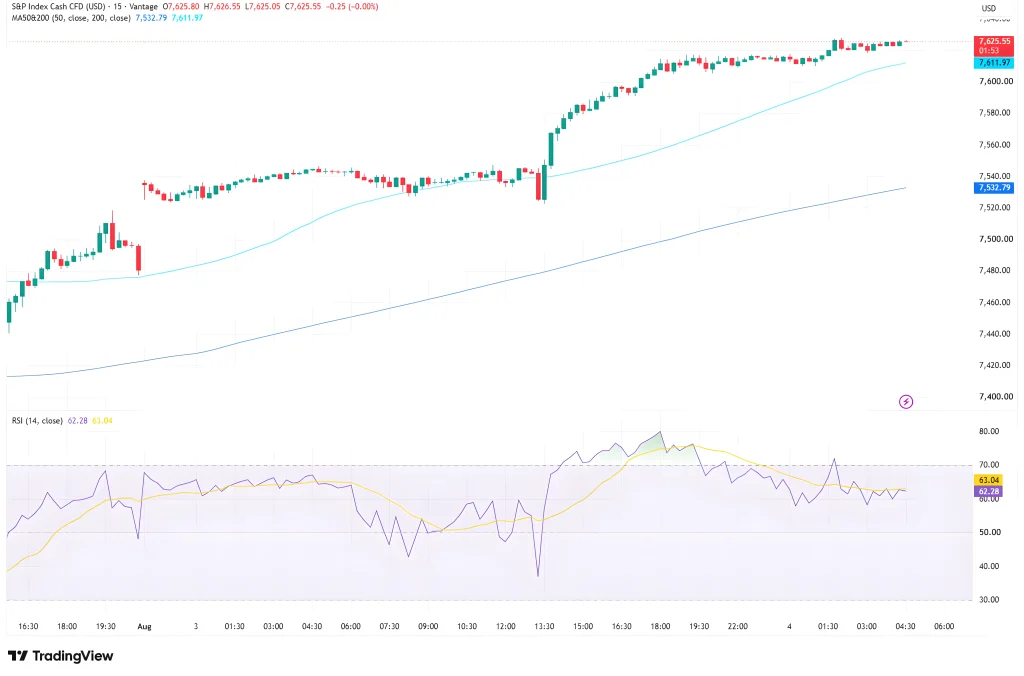
Zoom out on the 15-minute SP500 chart and the story is one decisive session. Price ran from a low near 7,520 shortly after the New York cash open on 3 August to today’s 7,625 area, just over 100 points, a move that reshapes the chart’s whole tone. The 50-period moving average, at 7,611.97, has flipped from resistance to support since the breakout candle, and the 200-period average at 7,532.79 is a distant memory by comparison.
The RSI (14) on the TradingView setup used for this analysis sits at 62.28, down from a peak closer to 80 while price was still climbing through 7,580 to 7,610. Price kept grinding higher; the RSI didn’t follow. That kind of quiet disagreement between momentum and price is worth flagging, not predicting.
SP500 News: Why Wall Street Rallied Into Tuesday
Monday did the heavy lifting. The S&P 500 gained 1.48% to close at 7,600.50, the Nasdaq Composite jumped 2.13% to 25,913.90, and the Dow added 1.32%, after President Trump said planned strikes against Iran had been called off, which pulled oil prices lower and took some of the edge off risk appetite.1
Megacap tech did most of the pulling: Amazon rose 4.6% and crossed a $3 trillion market capitalisation for the first time, while Microsoft, Alphabet, and Meta each gained between 4.9% and 6%, and Nvidia added 2.9%.2 When that much of the index’s weight moves together, the SP500 stock price doesn’t really have a choice in the matter.
The AI Trade Doubts Creeping Back In
Tuesday’s Asian session hasn’t read from the same script. Doubts about the artificial intelligence trade resurfaced after a volatile month for chip names, and South Korea’s Kospi fell as much as 1.9% on losses in SK Hynix and Samsung Electronics, with the broader MSCI Asia Pacific Index down 0.6% even as Wall Street’s own gains held.3
The S&P 500 itself finished Monday within striking distance of a record close, so the index carries real strength into today, even if the region that trades first isn’t fully convinced yet3. Add in SpaceX’s (SPCX) first public earnings report, due today, and the SP500 index has no shortage of reasons to stay interesting this session.4
Levels to Watch and Risk Considerations
The table below sets out the reference zones from the current chart. These are informational levels, not trade signals.
| Zone | Level | What It Represents |
| Resistance | 7,626.55 | Session high on the 15-minute chart as of the cut-off time |
| Near-term pivot | 7,600.00 | Monday’s closing level, a round-number reference |
| Support | 7,611.97 | 50-period moving average, now sitting just under spot |
| Support | 7,532.79 | 200-period moving average |
Volatility has been elevated given the size of Monday’s move, and the RSI divergence noted above means momentum could resolve in either direction from here. Standard intraday range assumptions carry more uncertainty than usual until the market digests both the AI-related caution out of Asia and today’s SpaceX print.
Leverage cuts both ways in a session like this one: it can magnify a loss just as easily as a gain, so size any exposure to the SP500 CFD to your account, not to the size of Monday’s candle. Learn more about what leverage means for your trades.
On exposure: given the breadth of the recent advance and the RSI divergence flagged above, Stop Loss placement around the support and resistance references in the table matters more than usual today. A Stop Loss limits losses to a planned size; it doesn’t prevent a loss outright, and where you place it should reflect your own risk tolerance, not ours.
On leverage and position sizing: the SP500 CFD is a leveraged product, so position size should be set as a proportion of account equity rather than around a specific price level. If you’re holding correlated positions across US indices or AI-linked share CFDs, it’s worth checking your combined exposure, since a reversal in the AI trade narrative above could move several of these instruments at once.
RISK WARNING: CFDs are complex financial instruments and carry a high risk of losing money rapidly due to leverage. You should ensure you fully understand the risks involved and carefully consider whether you can afford to take the high risk of losing your money before trading.
Disclaimer: The information is provided for educational purposes only and doesn’t take into account your personal objectives, financial circumstances, or needs. It does not constitute investment advice. We encourage you to seek independent advice if necessary. The information has not been prepared in accordance with legal requirements designed to promote the independence of investment research. No representation or warranty is given as to the accuracy or completeness of any information contained within. This material may contain historical or past performance figures and should not be relied on. Furthermore estimates, forward-looking statements, and forecasts cannot be guaranteed. The information on this site and the products and services offered are not intended for distribution to any person in any country or jurisdiction where such distribution or use would be contrary to local law or regulation.
References
[1] “Stock market news for Aug. 3, 2026 – CNBC” https://www.cnbc.com/2026/08/02/stock-market-today-live-updates.html Accessed on 4 August 2026.
[2] “United States Stock Market Index – Trading Economics” https://tradingeconomics.com/united-states/stock-market Accessed on 4 August 2026.
[3] “Stock Market Today: Dow, S&P Live Updates for August 4 – Bloomberg” https://www.bloomberg.com/news/articles/2026-08-03/stock-market-today-dow-s-p-live-updates Accessed on 4 August 2026.
[4] “Nasdaq, S&P 500 Futures Slip As Korea Chip Shock Dents AI Memory Heavyweights Ahead Of Fed Decision – Yahoo Finance” https://finance.yahoo.com/markets/stocks/articles/nasdaq-p-500-futures-slip-084655375.html Accessed on 4 August 2026.
Key Points In This Article

Latest Financial Market News


Market News Tags
- # USD News
- # USDCAD News
- # USDJPY News
- # USDX News
- # Forex News
- # Forex News Today
- # GBPUSD News
- # EURUSD News
- # Currency Trading News
- # AUDUSD news
Related Articles
- US Dollar Index Falls to 98.55 as Yields Ease, Fed Splits
- [DAILY TRADING] Pfizer Stock Price Today 21 August 2026 – $27.82 After CEO’s $1M Share Purchase
- [DAILY TRADING] AUD/USD Analysis 21 August 2026 — AUD/USD Hits 0.7150 as Dollar Slides, Aussie Jobs Miss
- [DAILY TRADING] Nasdaq 100 21 August 2026 – Climbs Back to 29,347 as Wall Street Waits on Jackson Hole
- PLTR Stock Price Today: August 2026 Chart Breakout & Key Levels
- [DAILY TRADING] Oracle Stock 21 August 2026 – ORCL Holds $142 as Pipeline Delay Meets Debt Fears
- [DAILY TRADING]: EUR/USD Analysis 21 August 2026 — EUR/USD Holds 1.1697, Near 3-Month High, ECB Hike Bets Firm
- [DAILY TRADING] Alibaba 21 August 2026 – BABA Stock Price Rebounds to $130.57 After Earnings Miss