
-

-


Download App
-


-

-

-
Search query too short. Please enter a full word or phrase.
-

Keywords
- Forex Trading
- Vantage Rewards
- Spreads
Popular Search
- Trading Accounts
- MT4
- MT5
- Copy Trading
- Promotions





Language


Commodities NewsCommodity Market NewsCPI NewsFeatured NewsFederal Reserve NewsGold NewsGold News TodayGold Price NewsInterest Rate NewsIran NewsMarket News TodayNFP NewsTechnical analysisTrending NewsVantage News
XAUUSD FAQ: Gold Price Today, Chart Levels & RSI

Vantage Editorial Team >
4 August 2026 | Market Analysis | 12 min read
Vantage Editorial Team >
Vantage is a global, multi-asset broker with a team of in-house writers and market analysts who produce educational and insightful trading content for traders of all levels.
Gold doesn’t pause for anyone’s publishing schedule, so instead of another dated snapshot, this page tracks the questions traders type into search most often about XAUUSD: what the ticker means, why gold’s price moves the way it does, and where the key levels on the XAUUSD chart sit right now.
Levels below are read from the Vantage XAUUSD 4-hour chart as of 07:05 (UTC) on 3 August 2026, and this page is reviewed periodically rather than tied to a single session. All prices are indicative and for informational purposes only, not a recommendation to trade in either direction.
What is XAUUSD and why does it move?
What does XAUUSD mean?
XAU is the ISO code for one troy ounce of gold, and XAUUSD simply quotes that ounce against the US dollar. Open a XAUUSD CFD with Vantage and a trader gets exposure to that price relationship without owning or storing any physical metal: the CFD tracks the move, it doesn’t represent a claim on the metal itself. Anyone new to the instrument can find a fuller walkthrough in Vantage’s gold trading guide.
Why does gold’s price move?
Gold pays no yield, so its price is unusually sensitive to the opportunity cost of holding it, which is a fancy way of saying real interest rates and Federal Reserve policy expectations remain the primary drivers. A firmer US dollar generally makes dollar-priced bullion pricier for overseas buyers, and a softer dollar does the opposite. Inflation data, central bank buying, and shifts in broader risk sentiment stack on top of that. Scheduled US data such as CPI, Non-Farm Payrolls, and FOMC meetings remain the events most likely to trigger a sharp move in gold prices within minutes.
Is the XAUUSD CFD price the same as the spot gold price?
It tracks spot gold closely, but the CFD price, spread, and any funding charges are specific to the platform and feed used. The levels and readings referenced throughout this XAUUSD technical analysis come from the Vantage XAUUSD chart and CFD feed specifically, so traders comparing gold prices across sources may see small differences depending on timing and feed.
Current key levels
The XAUUSD price traded at $4,061.12 as of the 07:05 (UTC) candle close on 3 August 2026, down $7.90 (-0.19%) on the four-hour candle, having ranged between $4,059.84 and $4,072.01, per the Vantage XAUUSD CFD.
| Level | Indicative price | Read from | Note |
| Broader resistance | ~$4,150 | July swing high | Late-July high before the latest pullback |
| Secondary resistance | ~$4,086 | 50-period MA (4H) | Next level up once the 200-period MA is cleared |
| Immediate resistance | ~$4,068 | 200-period MA (4H) | Sits within a few dollars of the last close |
| Immediate support | ~$4,000 | Psychological / July range low | Tested repeatedly through July |
| Broader support | ~$3,950 | July pullback low | Deeper support zone below the July range |
Table 1: Indicative XAUUSD levels read from the Vantage XAUUSD 4-hour chart on TradingView, as of 07:05 (UTC), 3 August 2026. Levels are reference zones for context, not trade signals.
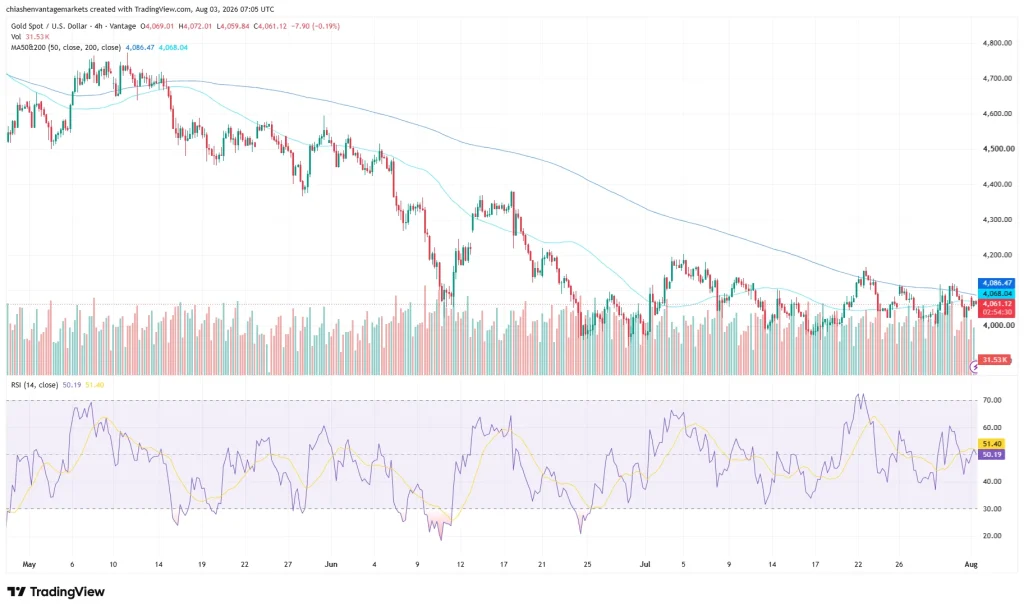
Price is sitting in a narrow band between its 50-period moving average, at $4,086.47, and its 200-period moving average, at $4,068.04, based on the XAUUSD TradingView setup used for this analysis. Trading between the two moving averages rather than clearing either one usually suggests a market awaiting a decisive catalyst. The 14-period RSI reads 50.19, with its signal line at 51.40, both close enough to the midline that this XAUUSD technical analysis reads neutral rather than overbought or oversold, based on the TradingView setup used for this analysis. Trading volume on the latest candle was 31.53K, per the Vantage CFD feed.
Gold has been in a broader retracement since peaking earlier in the year, with May, June, and July largely forming a pattern of lower highs before flattening into the current range. Independent quote services likewise show XAU/USD trading in the low-$4,000s through early August[1]. On the XAUUSD chart, traders watching for a shift out of this range are keeping an eye on the $4,000 handle to the downside and the $4,150 area to the upside.
What’s driving gold right now

Gold’s most recent leg lower has tracked a firmer US dollar, which hovered near a one-month high heading into the Federal Reserve’s late-July policy meeting, a dynamic that makes dollar-priced bullion more expensive for overseas buyers[2]. The Fed held its benchmark rate steady at that meeting, and gold’s initial reaction was a bounce as the dollar and Treasury yields eased while markets parsed remarks from Chair Kevin Warsh[3]. Three officials dissented in favour of a hike, and markets are now pricing around a two-thirds probability of a 25-basis-point increase in September, according to CME FedWatch[4], a sharp reversal from the rate-cut expectations that dominated gold’s narrative earlier in the year, layered alongside elevated energy prices linked to the ongoing Middle East conflict, which remain an inflation concern for the Fed[5].
Beneath the Fed headlines sits a steadier story: central bank demand. Net central bank gold purchases reached 289 tonnes in the second quarter of 2026, a five-fold increase on the revised first-quarter estimate and a record for any second quarter on record, according to World Gold Council data[6]. A separate WGC survey published in June found that 89% of reserve managers expect global central bank gold holdings to keep rising over the next 12 months, with a record share planning to add to their own institution’s reserves[7]. That kind of buying tends to be policy-driven rather than price-sensitive, which helps explain why gold news has stayed constructive even in stretches when the dollar and yields have worked against it.
Bank forecasts for where gold prices go from here vary widely and depend heavily on how the Fed’s rate path and the geopolitical backdrop resolve. J.P. Morgan’s Global Research team has floated a year-end figure as high as $6,000 an ounce, well above current levels, while separately noting that investor interest had cooled through the year[8]. Any single bank figure is one input among several rather than a fixed destination: markets are pricing a range of outcomes, not one answer, and that’s worth remembering the next time a headline treats a forecast as a fact.
Risk framing and what to watch
- US Non-Farm Payrolls, 7 August 2026: The first labour-market read since July’s report, with markets sensitive to any surprise given current rate-hike pricing.
- US CPI, 12 August 2026: The next major inflation print, and the release most likely to move September rate-hike odds in either direction.
- FOMC meeting, 16 September 2026: The Fed’s next scheduled rate decision, and the first chance for the committee to act on, or walk back, current market pricing for a hike.
- Middle East conflict developments: Any change in the conflict’s trajectory remains a swing factor for the energy-price and inflation backdrop currently shaping Fed expectations.
Given how closely gold has tracked Fed pricing and dollar moves this year, standard intraday range assumptions may be less reliable around data releases and FOMC dates. Stop Loss placement relative to the levels above is something market participants often revisit ahead of scheduled events, and those holding correlated positions, gold alongside the dollar or Treasury-sensitive pairs, may want to check their combined exposure, since a risk-on or risk-off move can affect several of these positions at once.
Leverage works both ways on an instrument that has moved several hundred dollars within a matter of weeks this year. Gold’s volatility means position sizing relative to account equity is worth revisiting regularly rather than set once and left alone, particularly around the data releases listed above. Traders new to the instrument may also find it useful to review when gold typically sees its strongest liquidity, since thinner sessions can see sharper moves on the same XAUUSD news.
For more of the day-to-day picture, Vantage’s XAUUSD news and gold price news tags round up the latest coverage, and the technical analysis tag covers chart-reading approaches across other instruments. For the macro side of the story, the Federal Reserve news tag tracks the policy decisions currently doing most of the work on gold’s price action.
RISK WARNING: CFDs are complex financial instruments and carry a high risk of losing money rapidly due to leverage. You should ensure you fully understand the risks involved and carefully consider whether you can afford to take the high risk of losing your money before trading.
Disclaimer: The information is provided for educational purposes only and doesn’t take into account your personal objectives, financial circumstances, or needs. It does not constitute investment advice. We encourage you to seek independent advice if necessary. The information has not been prepared in accordance with legal requirements designed to promote the independence of investment research. No representation or warranty is given as to the accuracy or completeness of any information contained within. This material may contain historical or past performance figures and should not be relied on. Furthermore estimates, forward-looking statements, and forecasts cannot be guaranteed. The information on this site and the products and services offered are not intended for distribution to any person in any country or jurisdiction where such distribution or use would be contrary to local law or regulation.
References
[1] “XAU/USD – Gold Spot US Dollar – Investing.com” https://www.investing.com/currencies/xau-usd Accessed on 3 August 2026.
[2] “Gold slips as firm dollar weighs, focus turns to Fed meeting – CNBC” https://www.cnbc.com/2026/07/28/gold-slips-as-firm-dollar-weighs-focus-turns-to-fed-meeting.html Accessed on 3 August 2026.
[3] “Gold ticks higher as markets brace for Fed decision – CNBC” https://www.cnbc.com/2026/07/29/gold-ticks-higher-as-markets-brace-for-fed-decision.html Accessed on 3 August 2026.
[4] “FedWatch – CME Group” https://www.cmegroup.com/markets/interest-rates/cme-fedwatch-tool.html Accessed on 3 August 2026.
[5] “Gold – Price – Chart – Historical Data – News – Trading Economics” https://tradingeconomics.com/commodity/gold Accessed on 3 August 2026.
[6] “Gold Demand Trends Q2 2026: Central Banks – World Gold Council” https://www.gold.org/goldhub/research/gold-demand-trends/gold-demand-trends-q2-2026/central-banks Accessed on 3 August 2026.
[7] “Central Banks Set to Step Up Gold Buying Over the Next Year – World Gold Council” https://www.gold.org/news-and-events/press-releases/central-banks-set-step-gold-buying-over-next-year Accessed on 3 August 2026.
[8] “Will Gold Prices Hit All-Time Highs Again in 2026? – J.P. Morgan” https://www.jpmorgan.com/insights/global-research/commodities/gold-prices Accessed on 3 August 2026.
Key Points In This Article

Latest Financial Market News


Market News Tags
- # USD News
- # USDCAD News
- # USDJPY News
- # USDX News
- # Forex News
- # Forex News Today
- # GBPUSD News
- # EURUSD News
- # Currency Trading News
- # AUDUSD news
Related Articles
- US Dollar Index Falls to 98.55 as Yields Ease, Fed Splits
- [DAILY TRADING] Pfizer Stock Price Today 21 August 2026 – $27.82 After CEO’s $1M Share Purchase
- [DAILY TRADING] AUD/USD Analysis 21 August 2026 — AUD/USD Hits 0.7150 as Dollar Slides, Aussie Jobs Miss
- [DAILY TRADING] Nasdaq 100 21 August 2026 – Climbs Back to 29,347 as Wall Street Waits on Jackson Hole
- PLTR Stock Price Today: August 2026 Chart Breakout & Key Levels
- [DAILY TRADING] Oracle Stock 21 August 2026 – ORCL Holds $142 as Pipeline Delay Meets Debt Fears
- [DAILY TRADING]: EUR/USD Analysis 21 August 2026 — EUR/USD Holds 1.1697, Near 3-Month High, ECB Hike Bets Firm
- [DAILY TRADING] Alibaba 21 August 2026 – BABA Stock Price Rebounds to $130.57 After Earnings Miss