
-

-


Download App
-


-

-

-
Search query too short. Please enter a full word or phrase.
-

Keywords
- Forex Trading
- Vantage Rewards
- Spreads
Popular Search
- Trading Accounts
- MT4
- MT5
- Copy Trading
- Promotions





Language

 Market Analysis Daily Analysis [DAILY TRADING] NVDA Analysis 12 August 2026 — Nvidia’s $500 Billion AI Deal Wiped $130bn Off the Stock. Here’s Where the Chart Sits Now
Earnings News TodayFeatured NewsFinancial NewsMarket News TodayNasdaq News TodayNVIDIA NewsStock Market NewsStock Market News TodayTechnical analysisTrading NewsTrading OpportunitiesTrending NewsVantage News
[DAILY TRADING] NVDA Analysis 12 August 2026 — Nvidia’s $500 Billion AI Deal Wiped $130bn Off the Stock. Here’s Where the Chart Sits Now

Vantage Editorial Team >
12 August 2026 | Daily Analysis | 11 min read
Vantage Editorial Team >
Vantage is a global, multi-asset broker with a team of in-house writers and market analysts who produce educational and insightful trading content for traders of all levels.
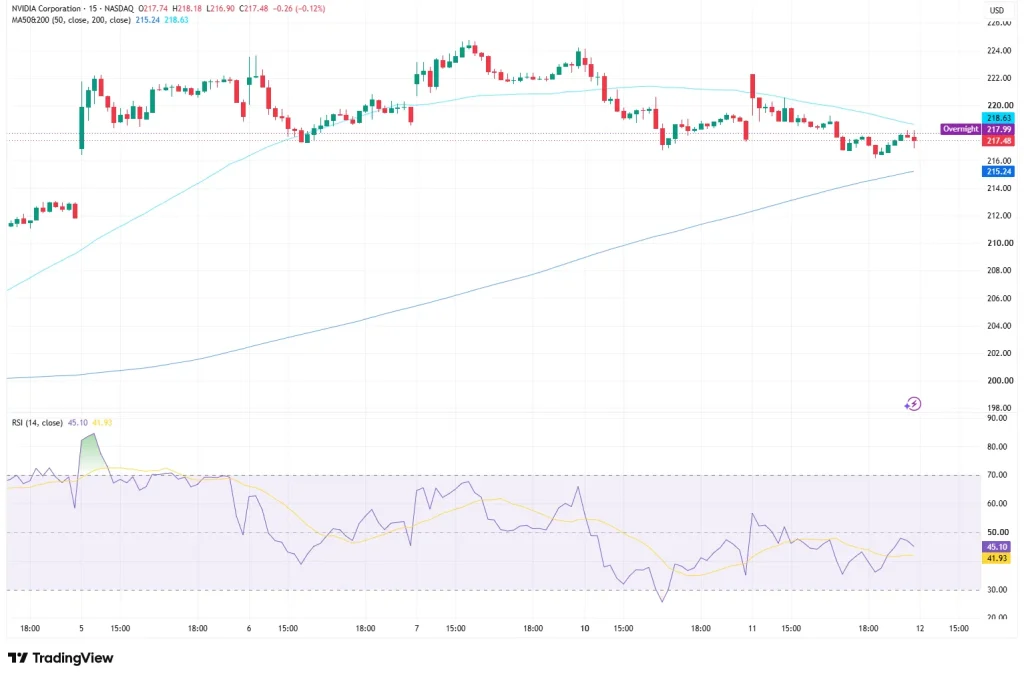
Nvidia (Nasdaq: NVDA) is having one of those weeks where the headline hit harder than anyone expected. As of 04:46 (UTC) on 12 August 2026, or 12:46 (GMT+8), the live overnight print on the NVDA share price sat at $217.99 on the Vantage NVDA Contracts for Difference (CFDs) feed, just above the $217.48 close of the most recent completed 15-minute bar (open $217.74, high $218.18, low $216.90, down 0.12% on that bar).
If you came here searching “NVDA stock price today” expecting fireworks, the chart itself has gone quiet again. Two sessions ago, it was anything but, and that is the real story behind today’s number.
What the NVDA Stock Chart Is Actually Showing
The NVDA stock chart has had a good week followed by a bad afternoon. The stock rallied from the low $210s on 4 and 5 August to a swing high above $224 by 6 and 7 August, roughly a 6% run. Then, on 10 August, it gave almost all of that back in a single session as Nvidia’s own financing news broke, more on that below, sliding straight down toward the $218 area. NVDA has spent the two sessions since consolidating right around $217 to $218, which is almost exactly where it sits now.
The moving averages capture that whiplash. The 50-period average reads $218.63 and the 200-period average reads $215.24 on the TradingView setup used for this analysis, so price is sitting almost exactly on the shorter line and comfortably clear of the longer one. The Relative Strength Index (RSI), 14-period close basis, reads 45.10 with its signal line at 41.93 on the same setup, both in neutral territory, below the 50 midpoint but well clear of the oversold 30 line. Momentum cooled sharply after the 10 August drop and has held roughly steady since, without tipping into oversold.
The $500 Billion Nvidia News Behind the Chart
Here is the Nvidia stock news that actually moved the needle this week, and the chart backs it up. On 10 August, reports first surfaced, and Nvidia itself confirmed the same day, that the company had signed memorandums of understanding with six Wall Street heavyweights, Apollo Global Management, BlackRock, Blackstone, Brookfield Asset Management, Goldman Sachs and KKR, aimed at mobilising more than $500 billion in third-party capital for AI infrastructure over time.1,3
A headline that size would normally send a stock higher. NVDA did the opposite: shares fell as much as 3% intraday and closed down 2.4% on 10 August, to around $218, erasing roughly $130 billion in market value and giving back most of a 5.6% prior rally.7 The reason: a worry that has followed Nvidia’s financing deals all year, when a chipmaker helps fund its own customers’ chip purchases, some investors see a closed loop, not fresh demand.7
Nvidia’s structure pushes back on that criticism. The $500 billion is third-party capital, not Nvidia’s balance sheet, and its own exposure is reportedly capped near 25% co-investment per deal.2 Nvidia called its hardware a new investable asset class, citing the long usage life of its chips and the software ecosystem around them.3 In a CNBC interview, chief executive Jensen Huang said he approached only these six firms, and none turned him down.5,6
NVDA Levels Traders Are Watching
The table below covers the zones active as of the overnight session on 12 August 2026. These are reference levels, not trade signals.
| Level | Price (USD) | Type | What’s Happening |
| Weekly swing high | ~224.00 | Resistance | 6 to 7 August high, before the 10 August drop |
| 50-period MA / session high | 218.63 / 218.18 | Resistance | Overhead cluster price has struggled to clear this session |
| Last price | 217.99 / 217.48 | Current | Overnight print / last completed candle, 12 August 2026 |
| Session low / 200-period MA | 216.90 / 215.24 | Support | Zone price has not tested since the 10 August drop |
| Weekly swing low | ~211.00 | Support | 4 to 5 August low, before the rally to the weekly high |
Table 1: Key levels as of 04:46 UTC (12:46 GMT+8), 12 August 2026. Sources: Vantage NVDA CFD, the TradingView setup used for this analysis. Indicative only.
The zone between the two moving averages, roughly $215.24 to $218.63, is where NVDA has been living since the 10 August drop. A clean move outside that band, in either direction, would be the first real test of the current pause.
What to Watch Next
- Q2 FY2027 earnings, 26 August, after market close: Nvidia’s next confirmed catalyst, and the first hard read on demand since this week’s financing headlines.7
- Financing platform detail, ongoing: the six-firm deal still needs definitive agreements, so any confirmed first project under the new platforms is a headline risk either way.2
- The $215 to $219 moving-average band, ongoing: the zone to watch should NVDA test lower from here.
NVDA Stock Outlook: What the Data Actually Supports
If you landed here chasing an NVDA stock forecast, an NVDA price target, or an NVDA stock prediction, the honest answer is that nobody serious calls a number off one financing headline and a single sharp session. What the data does support: NVDA gave back a hefty rally in a single day on financing-structure concerns, found a floor in the high $217s, and now heads into a confirmed earnings date with its momentum reset to neutral rather than broken.
Trading the Vantage NVDA CFD involves leverage, a double-edged tool that can magnify both gains and losses relative to the margin deployed, and losses can exceed the initial deposit. A Stop Loss can help define an intended exit level, though it will not eliminate gap or slippage risk during a week that already moved from $211 to $224 and back to $218 in a single session.
Position sizing relative to account equity is worth a second look given the size of those swings, and anyone holding correlated exposure across other AI-linked share CFDs may want to check the combined picture heading into 26 August. For more on the sector and the tools used in this analysis, see Vantage’s NVDA stock overview, its guide to RSI, MACD, and moving averages on TradingView, and the latest NVIDIA News and Nasdaq news today tags for ongoing coverage.
RISK WARNING: CFDs are complex financial instruments and carry a high risk of losing money rapidly due to leverage. You should ensure you fully understand the risks involved and carefully consider whether you can afford to take the high risk of losing your money before trading.
Disclaimer: The information is provided for educational purposes only and doesn’t take into account your personal objectives, financial circumstances, or needs. It does not constitute investment advice. We encourage you to seek independent advice if necessary. The information has not been prepared in accordance with legal requirements designed to promote the independence of investment research. No representation or warranty is given as to the accuracy or completeness of any information contained within. This material may contain historical or past performance figures and should not be relied on. Furthermore estimates, forward-looking statements, and forecasts cannot be guaranteed. The information on this site and the products and services offered are not intended for distribution to any person in any country or jurisdiction where such distribution or use would be contrary to local law or regulation.
References
[1] “Nvidia, Wall Street Partner on $500B AI Financing – Axios” https://www.axios.com/2026/08/10/nvidia-financing-ai-goldman-sachs-blackrock Accessed on 12 August 2026.
[2] “Nvidia Signs $500B Wall Street GPU Bond Deal; Rating Standard Unresolved – Tech Times” https://www.techtimes.com/articles/323876/20260811/nvidia-signs-500b-wall-street-gpu-bond-deal-rating-standard-unresolved.htm Accessed on 12 August 2026.
[3] “NVIDIA Partners With Apollo, BlackRock, Blackstone, Brookfield, Goldman Sachs and KKR – NVIDIA Newsroom” https://nvidianews.nvidia.com/news/nvidia-partners-with-apollo-blackrock-blackstone-brookfield-goldman-sachs-and-kkr-to-establish-ai-compute-infrastructure-financing-platforms-to-mobilize-over-500-billion-of-third-party-capital Accessed on 12 August 2026.
[4] “Nvidia Partners With Apollo, BlackRock, and Others on $500B AI Financing Push – Reuters via Yahoo Finance” https://finance.yahoo.com/technology/ai/articles/nvidia-partners-apollo-blackrock-others-150200750.html Accessed on 12 August 2026.
[5] “Nvidia Taps Wall Street for $500 Billion Funding Commitment – Bloomberg” https://www.bloomberg.com/news/articles/2026-08-10/nvidia-to-team-with-wall-street-on-500-billion-package-ft-says Accessed on 12 August 2026.
[6] “Nvidia Lines Up $500 Billion in Financing as CEO Jensen Huang Tells CNBC His Chips Are ‘Investable Asset’ – CNBC” https://www.cnbc.com/2026/08/10/nvidia-wall-street-asset-managers-500-billion-ai-push.html Accessed on 12 August 2026.
[7] “Nvidia Stock Loses $130 Billion In Market Value As Firm Reportedly Enters $500 Billion AI Financing Deal – Forbes” https://www.forbes.com/sites/antoniopequenoiv/2026/08/10/nvidia-stock-loses-130-billion-in-market-value-as-firm-reportedly-enters-500-billion-ai-financing-deal/ Accessed on 12 August 2026.
[8] “Nvidia Turns to Wall Street Giants to Raise $500bn for AI Infrastructure – The National” https://www.thenationalnews.com/business/markets/2026/08/11/nvidia-turns-to-wall-street-giants-to-raise-500bn-for-ai-infrastructure/ Accessed on 12 August 2026.
Key Points In This Article

Latest Financial Market News


Market News Tags
- # USD News
- # USDCAD News
- # USDJPY News
- # USDX News
- # Forex News
- # Forex News Today
- # GBPUSD News
- # EURUSD News
- # Currency Trading News
- # AUDUSD news
Related Articles
- US Dollar Index Falls to 98.55 as Yields Ease, Fed Splits
- [DAILY TRADING] Pfizer Stock Price Today 21 August 2026 – $27.82 After CEO’s $1M Share Purchase
- [DAILY TRADING] AUD/USD Analysis 21 August 2026 — AUD/USD Hits 0.7150 as Dollar Slides, Aussie Jobs Miss
- [DAILY TRADING] Nasdaq 100 21 August 2026 – Climbs Back to 29,347 as Wall Street Waits on Jackson Hole
- PLTR Stock Price Today: August 2026 Chart Breakout & Key Levels
- [DAILY TRADING] Oracle Stock 21 August 2026 – ORCL Holds $142 as Pipeline Delay Meets Debt Fears
- [DAILY TRADING]: EUR/USD Analysis 21 August 2026 — EUR/USD Holds 1.1697, Near 3-Month High, ECB Hike Bets Firm
- [DAILY TRADING] Alibaba 21 August 2026 – BABA Stock Price Rebounds to $130.57 After Earnings Miss