
-

-


Download App
-


-

-

-
Search query too short. Please enter a full word or phrase.
-

Keywords
- Forex Trading
- Vantage Rewards
- Spreads
Popular Search
- Trading Accounts
- MT4
- MT5
- Copy Trading
- Promotions





Language

 Market Analysis Weekly Analysis NVDA Stock Analysis August 2026: Nvidia’s Monthly Price Action and Outlook
Earnings News TodayFeatured NewsFinancial NewsMarket News TodayNVIDIA NewsStock Market NewsStock Market News TodayTechnical analysisTrending NewsVantage News
NVDA Stock Analysis August 2026: Nvidia’s Monthly Price Action and Outlook

Vantage Editorial Team >
5 August 2026 | Market Analysis | 12 min read
Vantage Editorial Team >
Vantage is a global, multi-asset broker with a team of in-house writers and market analysts who produce educational and insightful trading content for traders of all levels.
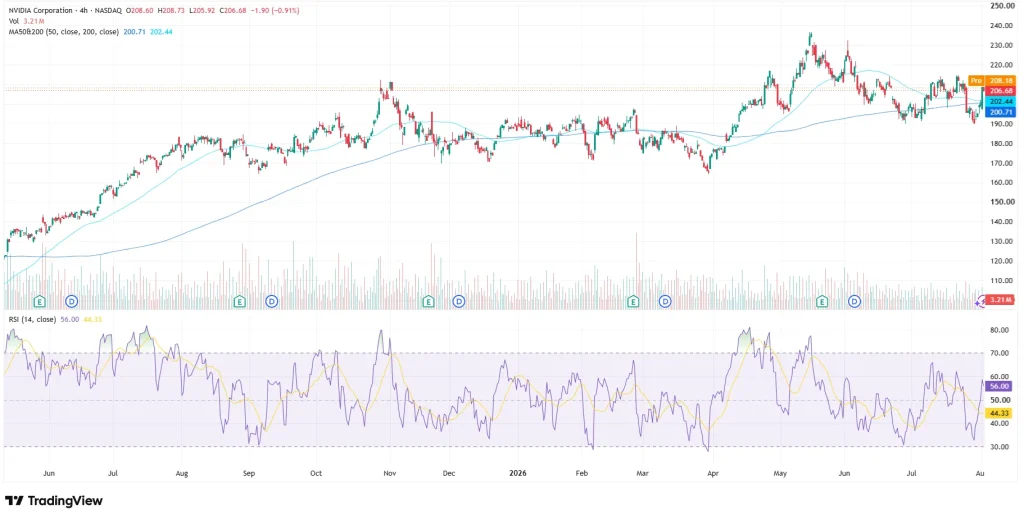
NVDA is having one of those months where the stock price and the news cycle can’t quite agree on a story. On the Nasdaq: NVDA ticker, NVIDIA CFD last traded at 206.68, down 1.90 (-0.91%), as of 08:57 UTC on 4 August 2026 on the 4-hour chart used for this analysis. The session opened at 208.60, ran to a high of 208.73, dipped to a low of 205.92, and closed with volume of 3.21 million contracts on the Vantage CFD feed.
Zoom out and the NVDA stock chart tells a familiar 2026 story: a sharp climb, a corrective phase, and a stock consolidating after a strong advance, with investors divided over whether the AI trade is merely pausing or entering a slower growth phase. This piece walks through the NVDA stock price action, the levels worth watching, what’s actually behind the NVDA stock news this month, and why the 26 August earnings report could provide greater clarity.
All prices are as of 08:57 UTC on 4 August 2026. Charts are indicative and from TradingView. This is not financial advice.
Key points
- NVDA stock price sits near 206.68, just above both its 50-day (200.71) and 200-day (202.44) moving averages on the NVDA stock chart, after pulling back from the spring peak.
- Semiconductor stocks collectively lost more than $1 trillion in market capitalisation during the late-July selloff amid renewed concerns over AI infrastructure spending, and NVDA has clawed back some of that ground since.
- The next big date on the NVDA stock outlook: NVIDIA reports fiscal second-quarter results after the close on 26 August, against guidance of approximately $91 billion in revenue.
NVDA price action this month
On the 4-hour NVDA stock chart, the broader trend is intact, but stretched thin. The Nasdaq NVDA ticker climbed from around 120 in mid-2025 to a peak just above 240 in late April and early May 2026, then pulled back hard through June before spending most of July and early August going sideways in a tighter band.
Right now, the NVDA share price is sitting just above both moving averages plotted on the chart: 200.71 (50-period) and 202.44 (200-period). That puts the 206.68 print roughly 4 to 6 points above both lines, a noticeably thinner cushion than NVDA has traded with for most of the year.
The RSI (14, close) reads 56.00, with its moving-average line at 44.33, per the TradingView setup used for this analysis. In plain terms, the stock has rebounded from the late-July semiconductor selloff while remaining inside a broader consolidation, without swinging back into overbought territory.
Since late April, the pattern has been lower highs against the spring peak, with NVDA repeatedly testing and holding the area around its moving averages rather than committing to a direction either way.
Key levels to watch
Here’s what the NVDA stock chart is actually showing, level by level. These are reference levels, not trade signals.
| Level type | Price | What it represents |
| Near-term support | 200.71 | 50-period moving average on the 4H chart |
| Near-term support | 202.44 | 200-period moving average on the 4H chart |
| Session resistance | 208.73 | Intraday high on the 4-hour candle as of the cut-off |
| Watch level | 208.18 | Pre-market print shown on the chart |
Table 1: Key levels as of 08:57 UTC, 4 August 2026. Source: the TradingView setup used for this analysis. Indicative only.
A few things stand out. The two moving averages are practically sitting on top of each other at 200.71 and 202.44, forming a support cluster right underneath the current NVDA share price. Slip below that cluster and the stock is back inside the wider consolidation range that dominated most of June and July.
The pre-market print of 208.18 and the session high of 208.73 sit close together just above spot too, marking an area where sellers have repeatedly emerged in recent sessions. Zoom out further and NVDA is still roughly 30 points below the near-240 peak from late April and early May: the moving-average cluster is one of the most important nearby support zones before price revisits the lower end of the summer range.
What’s driving the stock
The chip sector’s July selloff is still the story underneath the NVDA stock chart. Semiconductor stocks collectively lost more than $1 trillion in market capitalisation during the late-July selloff amid renewed concerns over AI infrastructure spending.1
Although Taiwan Semiconductor delivered strong earnings that same week, investors remained focused on whether accelerating capital expenditure across the AI supply chain could translate into sustainable returns, contributing to continued volatility across semiconductor stocks, including a 2.2% decline in NVDA shares on the day.3
Then there’s the circular financing worry: chipmakers with financial ties to the very customers buying their products. In short, investors worried that AI companies could increasingly be financing each other’s spending, raising questions over whether demand ultimately reflects sustainable end-customer need or a more closed loop.
NVDA fell nearly 5% in a single session in late July as this concern spread, alongside renewed questions about whether hyperscaler AI capital spending is actually paying for itself.4 Alphabet raised its 2026 capex outlook the same week, with markets awaiting similar signals from Microsoft, Amazon, and Meta.3
Against all that noise, NVIDIA’s own numbers have held up fine. Fiscal first-quarter revenue came in at 81.6 billion dollars in May, comfortably ahead of consensus, with guidance for the following quarter set at approximately 91 billion dollars.5 Management was also careful to note the outlook assumes zero data-centre compute revenue from China, since it remains an open question whether the company’s H200 chip will be allowed to sell there.5
NVIDIA reports its fiscal second-quarter results after the close on 26 August. According to consensus estimates available as of 4 August 2026, the average NVDA price target among analysts sits at approximately 314 dollars ahead of that print.2
So here’s the tension running through any honest NVDA stock forecast this month: the chart shows a name stabilised above its moving averages after a volatile July, while the fundamental argument over AI infrastructure spending, chip demand, and China access is nowhere near resolved. Earnings day will likely decide which story wins.
Risk framing for Stop Loss and leverage
The next three weeks carry two separate sources of volatility for the NVIDIA stock outlook: the ongoing sector-wide repricing of AI spending, and the 26 August earnings report itself, historically one of the biggest single-day movers on this stock.
What to watch:
- Earnings, 26 August 2026: NVIDIA’s fiscal second-quarter results, due after the market close, measured against guidance of approximately 91 billion dollars in revenue.2
- Hyperscaler capex commentary, ongoing: Microsoft, Amazon, and Meta capital-spending updates keep getting read as a proxy for near-term chip demand.3
- China chip policy, ongoing: whether H200 sales to Chinese customers get approved remains an open question for data-centre revenue, and NVIDIA’s own guidance already assumes the answer is no.5
Leverage on NVDA CFDs works in both directions: it can widen a loss just as easily as it can widen a gain, and that cuts hardest around a scheduled event like an earnings report, when overnight gaps are common rather than rare. Position sizing relative to account equity is worth a second look ahead of 26 August, particularly for anyone planning to hold through the announcement itself.
Market participants often keep an eye on levels such as the moving-average cluster near 200.71 to 202.44, and the resistance zone near 208.18 to 208.73, when thinking about Stop Loss placement and overall account exposure. This stock has not been shy about moving fast on news lately, and anyone holding NVDA alongside other AI-linked or semiconductor CFDs may want to check combined exposure, since these names have moved together closely through both the July selloff and the recovery that followed.
For a deeper look at the company itself, the NVIDIA stock outlook overview covers the business fundamentals, the RSI definition explains the indicator referenced above in more depth, and our prior NVDA coverage tracks how the stock got here from June.
RISK WARNING: CFDs are complex financial instruments and carry a high risk of losing money rapidly due to leverage. You should ensure you fully understand the risks involved and carefully consider whether you can afford to take the high risk of losing your money before trading.
Disclaimer: The information is provided for educational purposes only and doesn’t take into account your personal objectives, financial circumstances, or needs. It does not constitute investment advice. We encourage you to seek independent advice if necessary. The information has not been prepared in accordance with legal requirements designed to promote the independence of investment research. No representation or warranty is given as to the accuracy or completeness of any information contained within. This material may contain historical or past performance figures and should not be relied on. Furthermore estimates, forward-looking statements, and forecasts cannot be guaranteed. The information on this site and the products and services offered are not intended for distribution to any person in any country or jurisdiction where such distribution or use would be contrary to local law or regulation.
References
[1] “Chip stocks shed more than $1 trillion as selloff hits companies powering AI boom – CNBC” https://www.cnbc.com/2026/07/29/chip-selloff-sk-hynix-samsung-softbank.html Accessed on 4 August 2026.
[2] “NVIDIA Stock Reverses Early Loss and Jumps 3.1% – Yahoo Finance / GuruFocus” https://finance.yahoo.com/markets/stocks/articles/nvidia-stock-reverses-early-loss-183444121.html Accessed on 4 August 2026.
[3] “What to know about the AI chip stock selloff – ABC News” https://abcnews.com/Business/ai-chip-stock-selloff/story?id=134844421 Accessed on 4 August 2026.
[4] “Nvidia drops nearly 5%, leading chip stocks lower amid renewed worries of circular financing – Yahoo Finance” https://finance.yahoo.com/markets/article/nvidia-drops-nearly-5-leading-chip-stocks-lower-amid-renewed-worries-of-circular-financing-193309793.html Accessed on 4 August 2026.
[5] “Nvidia earnings takeaways: Data center revenue nearly doubles, report is strong but stock slides – CNBC” https://www.cnbc.com/2026/05/20/nvidia-nvda-earnings-report-q1-2027.html Accessed on 4 August 2026.
Key Points In This Article

Latest Financial Market News


Market News Tags
- # USD News
- # USDCAD News
- # USDJPY News
- # USDX News
- # Forex News
- # Forex News Today
- # GBPUSD News
- # EURUSD News
- # Currency Trading News
- # AUDUSD news
Related Articles
- US Dollar Index Falls to 98.55 as Yields Ease, Fed Splits
- [DAILY TRADING] Pfizer Stock Price Today 21 August 2026 – $27.82 After CEO’s $1M Share Purchase
- [DAILY TRADING] AUD/USD Analysis 21 August 2026 — AUD/USD Hits 0.7150 as Dollar Slides, Aussie Jobs Miss
- [DAILY TRADING] Nasdaq 100 21 August 2026 – Climbs Back to 29,347 as Wall Street Waits on Jackson Hole
- PLTR Stock Price Today: August 2026 Chart Breakout & Key Levels
- [DAILY TRADING] Oracle Stock 21 August 2026 – ORCL Holds $142 as Pipeline Delay Meets Debt Fears
- [DAILY TRADING]: EUR/USD Analysis 21 August 2026 — EUR/USD Holds 1.1697, Near 3-Month High, ECB Hike Bets Firm
- [DAILY TRADING] Alibaba 21 August 2026 – BABA Stock Price Rebounds to $130.57 After Earnings Miss