
-

-


Download App
-


-

-

-
Search query too short. Please enter a full word or phrase.
-

Keywords
- Forex Trading
- Vantage Rewards
- Spreads
Popular Search
- Trading Accounts
- MT4
- MT5
- Copy Trading
- Promotions





Language

 Market Analysis Daily Analysis [DAILY TRADING] Nikkei 225 Analysis 5 August 2026 — AI Rally Sends Index Surging Back Above 66,000
Earnings News TodayFeatured NewsFinancial NewsMarket News TodayNikkei225 NewsStock Market NewsStock Market News TodayTechnical analysisTrending NewsVantage News
[DAILY TRADING] Nikkei 225 Analysis 5 August 2026 — AI Rally Sends Index Surging Back Above 66,000

Vantage Editorial Team >
5 August 2026 | Daily Analysis | 9 min read
Vantage Editorial Team >
Vantage is a global, multi-asset broker with a team of in-house writers and market analysts who produce educational and insightful trading content for traders of all levels.
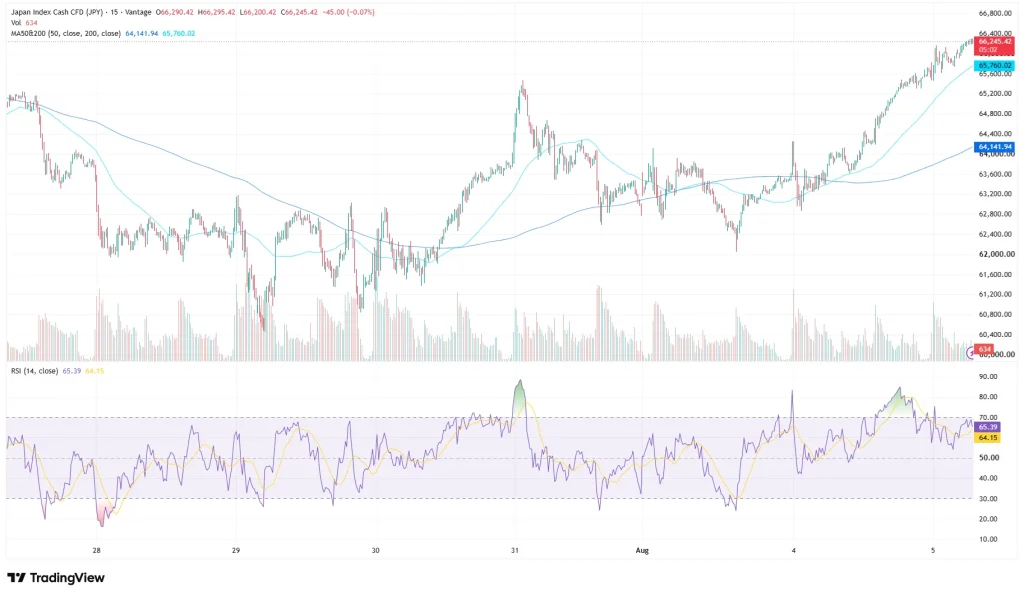
The Nikkei 225 is having a lively week. The Vantage Japan Index Cash CFD (Nikkei 225) traded near 66,245 as of 06:39 UTC (14:39 GMT+8) on 5 August 2026, up sharply from Tuesday’s low near 63,200. [1] Call it a snap-back: a record night on Wall Street and a burst of AI enthusiasm did the heavy lifting.
The Nikkei 225 index, also widely searched as Nikkei225 or the Nikkei share index, has moved back above both moving averages on the chart, with the RSI at 65.39, firm but not yet overbought. Here’s the chart, the drivers, and the levels worth watching.
Key Points
- In today’s Nikkei 225 news, the Vantage Nikkei 225 CFD traded near 66,245 as of 06:39 UTC (14:39 GMT+8) on 5 August 2026, up from Tuesday’s session low near 63,200 as AI and chip stocks led a rebound across the Nikkei stock market. [1][2]
- Wall Street closed at fresh records overnight, with the S&P 500 up 1.79% to 7,736.52 and the Nasdaq Composite up 2.59% to 26,584.99 (up almost 9% from its 29 July low), largely on the back of a 29% surge in Palantir shares. [3][9]
- Price has moved back above the 50-period moving average (64,141.94) and the 200-period moving average (65,760.02) on the chart used for this analysis, with the RSI at 65.39, attributed to the TradingView setup used for this analysis.
What the Chart Is Showing
Checking the Nikkei index today on the 15-minute Vantage chart tells a story of whiplash. Price fell toward 62,000 in late July, then rallied to a high near 65,600 on 31 July, pushing the RSI above 80. From 1 to 4 August, price consolidated between roughly 62,800 and 63,600, before a low near 63,200 on Tuesday. [1] That pullback extended a corrective phase from the index’s June peak above 73,000, flagged in earlier coverage. [8]
Today’s rally erased that stretch in one move. Price is back above the 200-period MA at 65,760.02 and the 50-period MA at 64,141.94, both read from the chart header. At the cut-off, the last 15-minute print sat at 66,245.42, down 45 points or -0.07% on that candle, with a session high of 66,295.42 and a low of 66,200.42. The RSI reads 65.39, signal line 64.15, attributed to the TradingView setup used for this analysis, having eased off a second overbought spike.
What’s Driving the Nikkei 225 Today
The rally traces back to Wall Street’s Tuesday session, where the S&P 500 gained 1.79% to a record 7,736.52 and the Nasdaq rose 2.59%, up almost 9% from its 29 July low. [3][9] Palantir jumped 29% on revenue up 93% to $1.94 billion, its best session in over two years, while a Caterpillar beat added to the momentum. [4] Treasury Secretary Scott Bessent said a deal to restore normal tanker transit through the Strait of Hormuz could be close, coinciding with oil easing and a risk-on mood. [4]
That mood didn’t stay in New York. Chip and AI names including SoftBank Group, Kioxia and Advantest extended gains in Tokyo, mirroring South Korea’s SK Hynix and Samsung Electronics and lifting the wider Asian markets. [2] The session follows Japan and the US confirming their first coordinated yen intervention since 2011, which had briefly pressured exporters through stronger yen levels earlier in the week, before today’s AI-led buying took over. [5][6]
Levels to Watch
The table below covers reference levels on the Vantage Nikkei 225 CFD as of the cut-off, for anyone tracking the Nikkei market index this session. These are reference zones, not trade signals.
| Level | Value | What’s Happening |
| Resistance / Pivot | 66,295.42 | Session high on the Vantage CFD feed as of the cut-off |
| Support | 65,760.02 | 200-period moving average; former resistance zone from late July |
| Support | 64,141.94 | 50-period moving average; price traded below this line for most of late July |
Table 1: Vantage Nikkei 225 CFD reference levels as of 06:39 UTC, 5 August 2026. Sources: TradingView, Trading Economics. Indicative only.
What to Watch This Week
- Strait of Hormuz Talks, Ongoing: Any confirmation of progress toward restoring normal tanker transit could keep energy prices easing and support the current risk-on tone across Asian equities. [4]
- Yen Intervention Follow-Through, Ongoing: Japan’s Ministry of Finance has said it stands ready to intervene again if yen movements become disorderly, a factor that could affect exporter-heavy names on the index. [5]
- Bank of Japan Monetary Policy Meeting, 17-18 September 2026: The next scheduled policy meeting is one traders are watching for any further signal on the pace of policy normalisation. [7]
- US and Japanese Earnings Flow, Ongoing: Corporate results from AI and chip names remain a swing factor for sentiment.
Given how quickly conditions have shifted this week, market participants often monitor their Stop Loss placement relative to the moving-average levels above, since a Stop Loss limits losses to a planned size rather than preventing them.
Leverage is a double-edged tool that can magnify gains and losses on a fast-moving index CFD, and position sizing is worth revisiting given this week’s swings. More on leverage, the Nikkei 225 CFD trading guide and the RSI academy page is available on the Vantage indices trading page.
For more Nikkei news and Nikkei 225 today news, see the previous Nikkei 225 chart analysis from 17 July 2026, or browse the latest Nikkei225 news for continued coverage.
RISK WARNING: CFDs are complex financial instruments and carry a high risk of losing money rapidly due to leverage. You should ensure you fully understand the risks involved and carefully consider whether you can afford to take the high risk of losing your money before trading.
Disclaimer: The information is provided for educational purposes only and doesn’t take into account your personal objectives, financial circumstances, or needs. It does not constitute investment advice. We encourage you to seek independent advice if necessary. The information has not been prepared in accordance with legal requirements designed to promote the independence of investment research. No representation or warranty is given as to the accuracy or completeness of any information contained within. This material may contain historical or past performance figures and should not be relied on. Furthermore estimates, forward-looking statements, and forecasts cannot be guaranteed. The information on this site and the products and services offered are not intended for distribution to any person in any country or jurisdiction where such distribution or use would be contrary to local law or regulation.
References
[1] “Japan Stock Market Index (JP225) – Trading Economics” https://tradingeconomics.com/japan/stock-market Accessed on 5 August 2026.
[2] “Japan and South Korea Stocks Rally as KOSPI Rises Over 4%, Nikkei 225 Gains 2% – TradingKey” https://www.tradingkey.com/analysis/stocks/more/262074716-japan-south-korea-stocks-rally-kospi-nikkei-softbank-sk-hynix-kioxia-tradingkey Accessed on 5 August 2026.
[3] “Dow Surges 900 Points, S&P 500 Closes Above 7,700 for First Time in Booming Wall Street Rally – CNBC” https://www.cnbc.com/2026/08/03/stock-market-today-live-updates.html Accessed on 5 August 2026.
[4] “S&P 500 Hits Record Highs, Palantir Jumps 27% – Benzinga” https://www.benzinga.com/markets/equities/26/08/60920438/tocks-hit-records-palantir-earnings-oil-sink-hormuz-deal-hopes-markets-tuesday Accessed on 5 August 2026.
[5] “U.S., Japan Confirm Coordinated Yen Intervention, Signal Readiness for More – CNBC” https://www.cnbc.com/2026/08/03/yen-intervention-us-japan-trump-bessent-katayama.html Accessed on 5 August 2026.
[6] “Japan and US Confirm Rare Joint Intervention to Prop Up Yen – Al Jazeera” https://www.aljazeera.com/economy/2026/8/3/japan-and-us-confirm-rare-joint-intervention-to-prop-up-yen Accessed on 5 August 2026.
[7] “Release Schedule – Bank of Japan” https://www.boj.or.jp/en/about/calendar/index.htm Accessed on 5 August 2026.
[8] “Nikkei 225 Bounces in Downtrend, 64,800 Key: Live Levels – Investing.com” https://ca.investing.com/news/stock-market-news/nikkei-225-stalls-at-jpy-64800-resistance-live-levels-93CH-4772945 Accessed on 5 August 2026.
[9] “The S&P 500 Is Back at a Record High and the Dow Just Hit 54,000 – CNN Business” https://www.cnn.com/2026/08/04/investing/us-stock-market Accessed on 5 August 2026.
Key Points In This Article

Latest Financial Market News


Market News Tags
- # USD News
- # USDCAD News
- # USDJPY News
- # USDX News
- # Forex News
- # Forex News Today
- # GBPUSD News
- # EURUSD News
- # Currency Trading News
- # AUDUSD news
Related Articles
- US Dollar Index Falls to 98.55 as Yields Ease, Fed Splits
- [DAILY TRADING] Pfizer Stock Price Today 21 August 2026 – $27.82 After CEO’s $1M Share Purchase
- [DAILY TRADING] AUD/USD Analysis 21 August 2026 — AUD/USD Hits 0.7150 as Dollar Slides, Aussie Jobs Miss
- [DAILY TRADING] Nasdaq 100 21 August 2026 – Climbs Back to 29,347 as Wall Street Waits on Jackson Hole
- PLTR Stock Price Today: August 2026 Chart Breakout & Key Levels
- [DAILY TRADING] Oracle Stock 21 August 2026 – ORCL Holds $142 as Pipeline Delay Meets Debt Fears
- [DAILY TRADING]: EUR/USD Analysis 21 August 2026 — EUR/USD Holds 1.1697, Near 3-Month High, ECB Hike Bets Firm
- [DAILY TRADING] Alibaba 21 August 2026 – BABA Stock Price Rebounds to $130.57 After Earnings Miss