
-

-


Download App
-


-

-

-
Search query too short. Please enter a full word or phrase.
-

Keywords
- Forex Trading
- Vantage Rewards
- Spreads
Popular Search
- Trading Accounts
- MT4
- MT5
- Copy Trading
- Promotions





Language

 Market Analysis Daily Analysis [DAILY TRADING] DJ30 Analysis 5 August 2026 – Dow Jones Holds Near Record After Earnings-Fuelled Surge
DJ30 NewsEarnings News TodayFeatured NewsFinancial NewsMarket News TodayStock Market NewsStock Market News TodayTechnical analysisTrending NewsVantage News
[DAILY TRADING] DJ30 Analysis 5 August 2026 – Dow Jones Holds Near Record After Earnings-Fuelled Surge

Vantage Editorial Team >
5 August 2026 | Daily Analysis | 9 min read
Vantage Editorial Team >
Vantage is a global, multi-asset broker with a team of in-house writers and market analysts who produce educational and insightful trading content for traders of all levels.
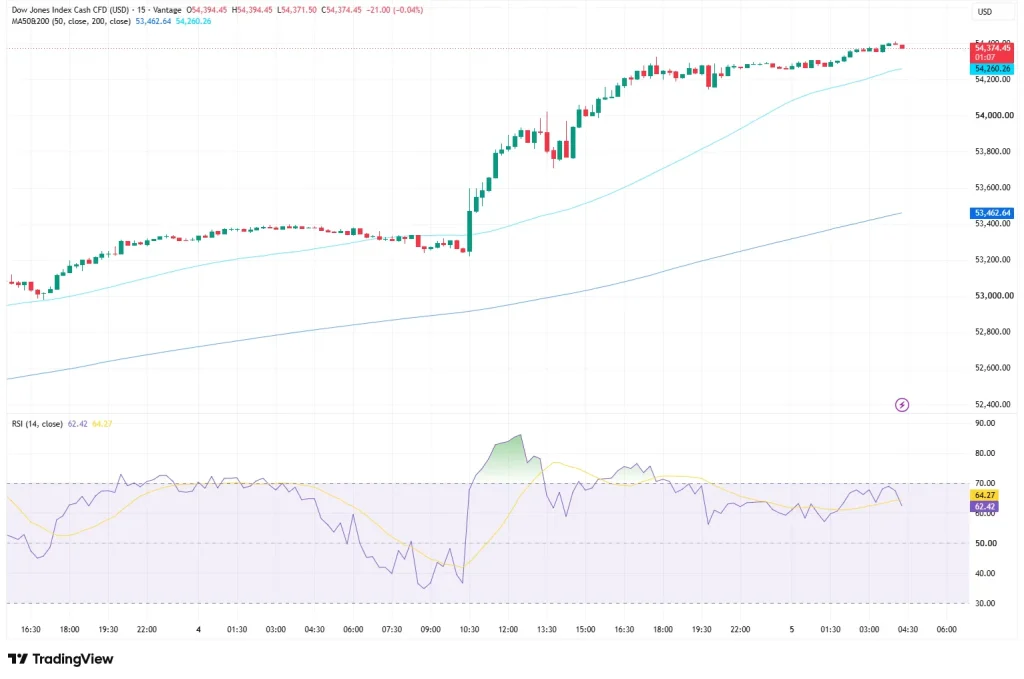
Where does the Dow Jones stand right now? As of 12:30 (GMT+8) on 5 August 2026, the Vantage DJ30 CFD is changing hands at 54,374.45, just off the 54,371.50 to 54,394.45 range of the latest 15-minute candle, a day removed from a fresh record. The Dow Jones average leapt 907.47 points on Tuesday to close at 54,085.881, and today’s chart suggests that momentum hasn’t faded.
This piece reads the Dow Jones index chart at the cut-off above. It’s a read, not a signal to buy or sell.
What the DJ30 Chart is Showing Right Now
Scroll back through the 15-minute DJ30 chart and the overnight session looks almost sleepy: price drifted between roughly 53,200 and 53,400 for hours. Then, at 10:30, something clicked. Within the hour, price tore through 53,600 toward 54,000, pulled back to around 53,800 to 53,900 into the early afternoon, then pushed higher again from about 13:30, clearing 54,200 and trading above 54,300 by the evening. The current Dow Jones index level has since settled into a tighter band between roughly 54,000 and 54,400.
Price is holding above both moving averages on this Dow Jones index chart: the 50-period average sits near 53,462.64 and the 200-period average near 54,260.26, so the Dow Jones share index is only modestly above its longer-term line after the rally. The Relative Strength Index (RSI), on the TradingView setup used for this analysis, pushed above 70 during the sharpest part of the rally before easing back; it now reads 62.42, moving average 64.27: healthy momentum, not stretched.
Why the Dow Jones Surged, in Plain English
Tuesday’s Dow Jones news was, at heart, an earnings story. Caterpillar beat expectations and raised guidance; Cisco Systems and IBM did much of the rest of Tuesday’s lifting among Dow Jones stocks.2 That built on Monday’s session, when Amazon crossed a $3 trillion market capitalisation for the first time1 (it then slipped around 2% on Tuesday after a Bezos share-sale filing, a reminder that Dow components don’t all move together1).
The S&P 500 and Nasdaq Composite rode Tuesday’s wave alongside the Dow, up 1.79% and 2.59%.1 Add a geopolitical tailwind: progress toward an interim understanding between Washington and Tehran eased Middle East supply concerns, and Brent crude fell around 5% to a three-week low.3 Cheaper oil eased inflation pressure and helped the risk-on trade run3, Asian futures tracked Wall Street higher into today’s session on the same optimism.6
What Could Move the Dow Jones Today
A busy data slate sits between here and the New York close. ADP employment change is forecast around 68,000 new private jobs, down from 98,000 previously4 (a separate consensus puts it nearer 75,0007). ISM Non-Manufacturing PMI is expected at 54.5, versus 54.0 last month, alongside S&P Global Composite PMI at 53.64, and weekly EIA crude inventories land later.4 Earnings season isn’t slowing either: Eli Lilly, Walt Disney, Novo Nordisk, Shopify, CVS, Uber, Sandisk and Western Digital are all due5, and given how earnings-driven this week already is, any surprise could spill into the wider index. Vantage’s earnings news coverage and DJ30 news tags track it in real time.
Dow Jones Levels to Watch, and the Risk Side of the Ledger
| Level | Price (DJ30 CFD) | What it means |
| Latest 15-min candle, high | 54,394.45 | High of the most recent candle only, not the full session; nearest overhead reference. |
| Latest 15-min candle, low | 54,371.50 | Low of the same candle; the range has stayed narrow so far. |
| 200-period average | 54,260.26 | The nearest trend reference beneath current price. |
| 50-period average | 53,462.64 | A longer-term reference, well below current levels after the recent rally. |
Table 1: Vantage DJ30 CFD levels as of 12:30 (GMT+8), 5 August 2026, based on the latest 15-minute candle and the moving averages on the same chart. Data indicative, informational only.
The latest candle’s range is narrow, but the DJ30 as a whole stays sensitive to headlines today. A push back above 54,394.45 would extend the advance; a slip toward the 200-period average near 54,260.26 would test whether buyers are still in charge. Leverage on index CFDs cuts both ways, so a position near these levels carries as much downside as upside.
Given how fast today’s session accelerated once the 10:30 breakout began, Stop Loss placement relative to the day’s range is worth more attention than usual. Anyone holding US30 alongside other US equity index exposure should also weigh correlated risk, since one large-cap benchmark reversing tends to ripple across the rest at once.
Leverage remains a double-edged tool on any index CFD position; it can magnify a loss as easily as a gain. Position sizing relative to account equity is worth revisiting ahead of the ADP print and the PMI releases. For more on how the Dow Jones Industrial Average behaves as a CFD instrument, Vantage’s trading guide is a good place to start.
RISK WARNING: CFDs are complex financial instruments and carry a high risk of losing money rapidly due to leverage. You should ensure you fully understand the risks involved and carefully consider whether you can afford to take the high risk of losing your money before trading.
Disclaimer: The information is provided for educational purposes only and doesn’t take into account your personal objectives, financial circumstances, or needs. It does not constitute investment advice. We encourage you to seek independent advice if necessary. The information has not been prepared in accordance with legal requirements designed to promote the independence of investment research. No representation or warranty is given as to the accuracy or completeness of any information contained within. This material may contain historical or past performance figures and should not be relied on. Furthermore, estimates, forward-looking statements and forecasts cannot be guaranteed. The information on this site and the products and services offered are not intended for distribution to any person in any country or jurisdiction where such distribution or use would be contrary to local law or regulation.
References
[1] “Dow surges 900 points, S&P 500 closes above 7,700 for first time in booming Wall Street rally – CNBC” https://www.cnbc.com/2026/08/03/stock-market-today-live-updates.html Accessed on 5 August 2026.
[2] “US Stocks Hit Record Highs as Strong Earnings Fuel Rally – Trading Economics” https://tradingeconomics.com/united-states/stock-market Accessed on 5 August 2026.
[3] “Stock Market Today: Live Updates – TS2 Space” https://ts2.tech/en/stock-market-today-04-08-2026/ Accessed on 5 August 2026.
[4] “ADP jobs data, PMI surveys and oil inventories due Wednesday – Investing.com” https://ng.investing.com/news/stock-market-news/adp-jobs-data-pmi-surveys-and-oil-inventories-due-wednesday-93CH-2637534 Accessed on 5 August 2026.
[5] “Earnings Blitz, Peace Hopes Provide Early Boost – Charles Schwab” https://www.schwab.com/learn/story/stock-market-update-open Accessed on 5 August 2026.
[6] “Stock Market Today: Dow, S&P Live Updates for August 5 – Bloomberg” https://www.bloomberg.com/news/articles/2026-08-04/stock-market-today-dow-s-p-live-updates Accessed on 5 August 2026.
[7] “S&P 500 futures are little changed after massive rally lifts index to fresh record: Live updates – CNBC” https://www.cnbc.com/2026/08/04/stock-market-today-live-updates.html Accessed on 5 August 2026.
Key Points In This Article

Latest Financial Market News


Market News Tags
- # USD News
- # USDCAD News
- # USDJPY News
- # USDX News
- # Forex News
- # Forex News Today
- # GBPUSD News
- # EURUSD News
- # Currency Trading News
- # AUDUSD news
Related Articles
- US Dollar Index Falls to 98.55 as Yields Ease, Fed Splits
- [DAILY TRADING] Pfizer Stock Price Today 21 August 2026 – $27.82 After CEO’s $1M Share Purchase
- [DAILY TRADING] AUD/USD Analysis 21 August 2026 — AUD/USD Hits 0.7150 as Dollar Slides, Aussie Jobs Miss
- [DAILY TRADING] Nasdaq 100 21 August 2026 – Climbs Back to 29,347 as Wall Street Waits on Jackson Hole
- PLTR Stock Price Today: August 2026 Chart Breakout & Key Levels
- [DAILY TRADING] Oracle Stock 21 August 2026 – ORCL Holds $142 as Pipeline Delay Meets Debt Fears
- [DAILY TRADING]: EUR/USD Analysis 21 August 2026 — EUR/USD Holds 1.1697, Near 3-Month High, ECB Hike Bets Firm
- [DAILY TRADING] Alibaba 21 August 2026 – BABA Stock Price Rebounds to $130.57 After Earnings Miss