
-

-


Download App
-


-

-

-
Search query too short. Please enter a full word or phrase.
-

Keywords
- Forex Trading
- Vantage Rewards
- Spreads
Popular Search
- Trading Accounts
- MT4
- MT5
- Copy Trading
- Promotions





Language

 Market Analysis Daily Analysis [DAILY TRADING] Crude Oil Price Today, 7 August 2026: Brent and WTI Push Higher as the Hormuz Question Lingers
Brent Crude Oil NewsCommodities NewsCommodity Market NewsCrude Oil News TodayEconomic News TodayFeatured NewsFinancial NewsMarket News TodayOil NewsOil Price News TodayTechnical analysisTrending NewsVantage NewsWTI Crude OIl News
[DAILY TRADING] Crude Oil Price Today, 7 August 2026: Brent and WTI Push Higher as the Hormuz Question Lingers

Vantage Editorial Team >
7 August 2026 | Daily Analysis | 10 min read
Vantage Editorial Team >
Vantage is a global, multi-asset broker with a team of in-house writers and market analysts who produce educational and insightful trading content for traders of all levels.
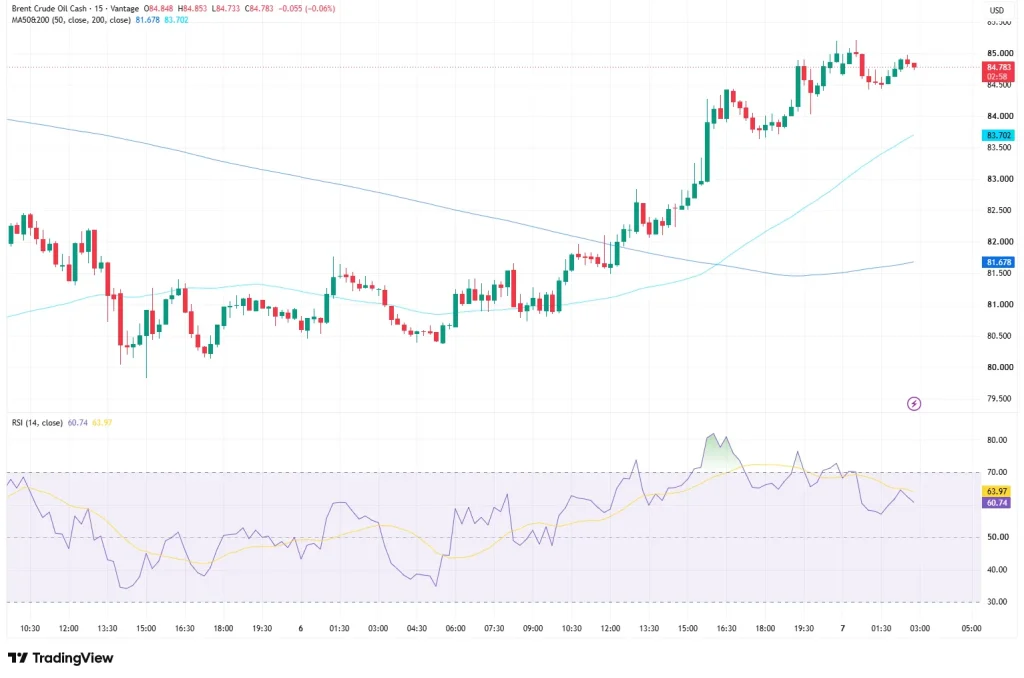
Crude oil is back in a familiar spot this morning: climbing on geopolitics rather than fundamentals. The crude oil price today has Brent (UKOUSD) trading near $84.78 a barrel and WTI (USOUSD) near $78.16, as of 10:58 (GMT+8) / 02:58 UTC for Brent and 10:23 (GMT+8) / 02:23 UTC for WTI on 7 August 2026, both benchmarks pushing back toward levels last seen before last week’s pullback. The driver isn’t a supply shock. It’s the Strait of Hormuz, again, and a shipping deal that keeps getting harder to actually sign.
Prices are attributed to the Vantage UKOUSD and USOUSD CFD feeds and are accurate as of the stated cut-off. Charts are indicative and sourced from TradingView. This is not financial advice.
What the Oil Price Chart is Showing Today
Brent opened at $84.85, ranged between $84.73 and $84.85, and last traded at $84.78, a modest $0.06 pullback (-0.06%) on the 15-minute bar, part of a clean five-session climb from a local low near $80.50 on 5 August to a fresh push above $85.00 by the morning of 7 August.
Both moving averages agree with that read. The 50-period sits at $83.70 and the 200-period at $81.68, with price comfortably above both. The RSI (14, close) on the TradingView setup used for this analysis reads 60.74, having briefly poked into the high-70s earlier in the session before settling back under its own 63.97 moving average. Momentum has cooled, not cracked.
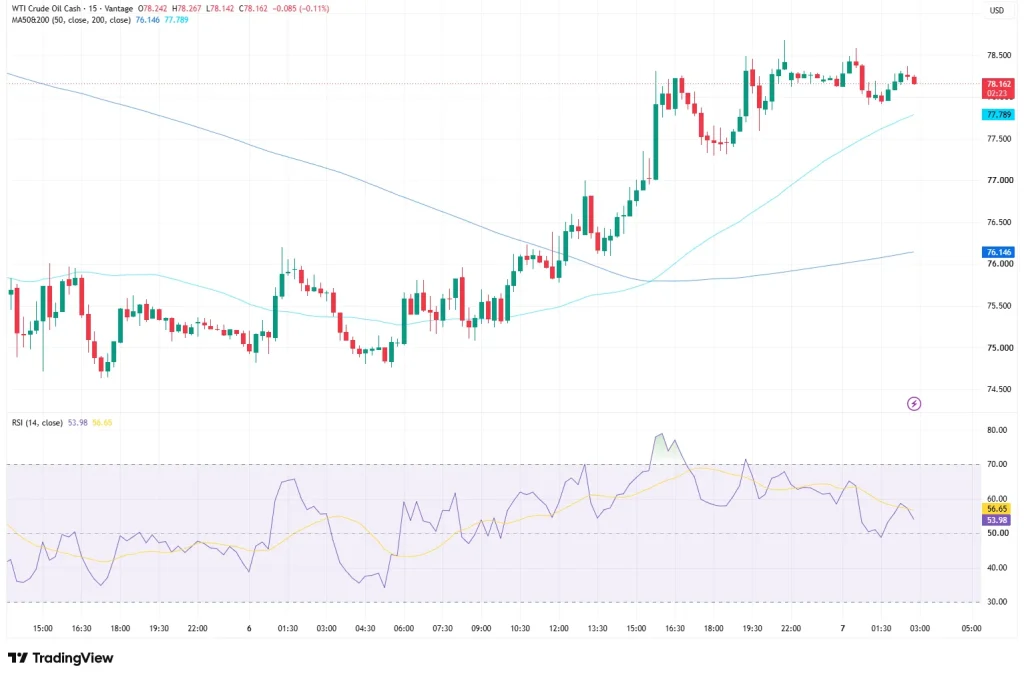
WTI tells a quieter version of the same story: it opened at $78.24, ranged from $78.14 to $78.27, and last printed $78.16, down $0.09 (-0.11%), having climbed from near $75.00 on 5 August to a high just above $78.50 the next day, where it’s now parked.
Its 50- and 200-period averages read $77.79 and $76.15, both below the current price. RSI at 53.98 sits under its own 56.65 average, a smaller move than Brent’s, tracking with WTI’s slightly smaller advance this week.
Crude Oil News Today: The Hormuz Story That Won’t Resolve
Here’s what’s keeping this rally alive: the Iran-Oman shipping arrangement for the Strait of Hormuz still hasn’t cleared Iran’s parliament, and the draft under review is tougher than markets first priced in.1 It would bar US and Israeli vessels outright and fine violators a fifth of their cargo’s value, with Tehran tying any full arrangement to the US lifting its maritime blockade first. That’s not a minor technicality. It’s the difference between a deal and a headline about a deal.
Iran said it struck hostile targets inside the strait after explosions were reported near Qeshm Island, even as Washington pulled back from further action, with President Trump saying he had called off a planned strike.2 Tehran denied any US talks were scheduled. Neither side is fully at the table, and that gap keeps a risk premium priced into the barrel.
The Red Sea hasn’t gone quiet either. Houthi forces in Yemen claimed fresh strikes on Saudi positions and threatened more vessels.3 Saudi Aramco cut its official selling price for Asian buyers in the same window, a move that typically signals improving supply rather than scarcity.3 Right now, the market is choosing to believe the scarier story.
July was already a big month for oil, Brent added 24% and WTI 21%, the strongest month since March, even with a two-tanker attack rattling the tape in its final days.4,5 US crude inventories rose from their lowest level since 2018, sitting awkwardly next to crude oil prices today still trading on supply-risk headlines.3 The EIA’s own outlook had pencilled in a calmer Brent, averaging $74 a barrel for the third quarter, a forecast written before this Hormuz drama began.6
Levels Traders Are Watching
The table below covers the zones traders are watching across both crude oil prices today. These are reference levels, not trade signals.
| Pair | Support | Resistance | What’s happening |
| UKOUSD (Brent Oil) | $83.70 (50-period MA) / $81.68 (200-period MA) | $85.00 (7 August high) | Holding above both moving averages, cooling slightly after the push toward $85.00 |
| USOUSD (WTI) | $77.79 (50-period MA) / $76.15 (200-period MA) | $78.50 (6 August high) | Consolidating just under the recent high, above both moving averages |
Table 1: Support and resistance levels as of 10:58 (GMT+8) / 02:58 UTC for Brent and 10:23 (GMT+8) / 02:23 UTC for WTI, 7 August 2026. Sources: TradingView, Vantage CFD feed. Indicative only.
What To Watch Next
- Iran’s parliament vote on the Hormuz shipping draft, ongoing: the cargo-value penalty and vessel restrictions under review will shape how much of the current risk premium persists.1
- EIA Weekly Petroleum Status Report, next release 12 August 2026: another inventory build would widen the gap between the supply picture and the price action on the chart.7
- Strait of Hormuz and Red Sea shipping data, ongoing: tanker-tracking updates remain the clearest read on whether disruption is actually happening on the water, separate from the headlines.3
Both benchmarks have moved several dollars a barrel inside a handful of sessions this month. In a market this headline-sensitive, a Stop Loss can still fill at a materially worse price than the level set, particularly overnight or around fresh Hormuz news. Holding both UKOUSD and USOUSD together is also one trade on oil-market risk, not two, even if it looks diversified on paper.
Leverage cuts both ways here, and margin requirements on oil CFDs can move quickly once the Strait of Hormuz is back in the headlines. Position sizing relative to account equity deserves a second look while the shipping arrangement stays unresolved.
For ongoing coverage, follow Vantage’s Brent Crude Oil News and WTI Crude Oil News tags, or the wider Crude Oil News Today feed for updates as the Hormuz story develops.
RISK WARNING: CFDs are complex financial instruments and carry a high risk of losing money rapidly due to leverage. You should ensure you fully understand the risks involved and carefully consider whether you can afford to take the high risk of losing your money before trading.
Disclaimer: The information is provided for educational purposes only and doesn’t take into account your personal objectives, financial circumstances, or needs. It does not constitute investment advice. We encourage you to seek independent advice if necessary. The information has not been prepared in accordance with legal requirements designed to promote the independence of investment research. No representation or warranty is given as to the accuracy or completeness of any information contained within. This material may contain historical or past performance figures and should not be relied on. Furthermore estimates, forward-looking statements, and forecasts cannot be guaranteed. The information on this site and the products and services offered are not intended for distribution to any person in any country or jurisdiction where such distribution or use would be contrary to local law or regulation.
References
[1] “Brent crude oil – Price – Chart – Historical Data – News – Trading Economics” https://tradingeconomics.com/commodity/brent-crude-oil Accessed on 7 August 2026.
[2] “Oil prices: WTI, Brent: Trump says he called off planned strike on Iran – CNBC” https://www.cnbc.com/2026/08/03/oil-prices-today-wti-brent-hormuz-trump-iran.html Accessed on 7 August 2026.
[3] “Crude Oil – Price – Chart – Historical Data – News – Trading Economics” https://tradingeconomics.com/commodity/crude-oil Accessed on 7 August 2026.
[4] “Oil prices rise after Iran says it attacked two tankers transiting Strait of Hormuz – CNBC” https://www.cnbc.com/2026/07/31/oil-prices-today-brent-wti-hormuz-trump-iran-.html Accessed on 7 August 2026.
[5] “Oil Prices Settle More Than 1% Higher, Log Strongest Month Since March – EnergyNow (Reuters)” https://energynow.com/2026/08/oil-price-rises-after-iran-says-it-stops-ships-in-hormuz/ Accessed on 7 August 2026.
[6] “Short-Term Energy Outlook – U.S. Energy Information Administration” https://www.eia.gov/outlooks/steo/ Accessed on 7 August 2026.
[7] “Weekly Petroleum Status Report – U.S. Energy Information Administration” https://www.eia.gov/petroleum/supply/weekly/ Accessed on 7 August 2026.
Key Points In This Article

Latest Financial Market News


Market News Tags
- # USD News
- # USDCAD News
- # USDJPY News
- # USDX News
- # Forex News
- # Forex News Today
- # GBPUSD News
- # EURUSD News
- # Currency Trading News
- # AUDUSD news
Related Articles
- US Dollar Index Falls to 98.55 as Yields Ease, Fed Splits
- [DAILY TRADING] Pfizer Stock Price Today 21 August 2026 – $27.82 After CEO’s $1M Share Purchase
- [DAILY TRADING] AUD/USD Analysis 21 August 2026 — AUD/USD Hits 0.7150 as Dollar Slides, Aussie Jobs Miss
- [DAILY TRADING] Nasdaq 100 21 August 2026 – Climbs Back to 29,347 as Wall Street Waits on Jackson Hole
- PLTR Stock Price Today: August 2026 Chart Breakout & Key Levels
- [DAILY TRADING] Oracle Stock 21 August 2026 – ORCL Holds $142 as Pipeline Delay Meets Debt Fears
- [DAILY TRADING]: EUR/USD Analysis 21 August 2026 — EUR/USD Holds 1.1697, Near 3-Month High, ECB Hike Bets Firm
- [DAILY TRADING] Alibaba 21 August 2026 – BABA Stock Price Rebounds to $130.57 After Earnings Miss