
-

-


Download App
-


-

-

-
Search query too short. Please enter a full word or phrase.
-

Keywords
- Forex Trading
- Vantage Rewards
- Spreads
Popular Search
- Trading Accounts
- MT4
- MT5
- Copy Trading
- Promotions





Language

 Market Analysis Weekly Analysis Brent Crude Oil Price Today: Brent and WTI Clear the 200-Day Line as Hormuz Deal Nears
Brent Crude Oil NewsCommodities NewsCommodity Market NewsCrude Oil News TodayEconomic News TodayFeatured NewsMarket News TodayOil NewsOil Price News TodayTechnical analysisTrending NewsVantage NewsWTI Crude OIl News
Brent Crude Oil Price Today: Brent and WTI Clear the 200-Day Line as Hormuz Deal Nears

Vantage Editorial Team >
11 August 2026 | Market Analysis | 12 min read
Vantage Editorial Team >
Vantage is a global, multi-asset broker with a team of in-house writers and market analysts who produce educational and insightful trading content for traders of all levels.
Crude oil news today has a number worth checking for yourself: both Brent and WTI have closed back above their 200-day moving average, on the same day Iran’s Foreign Ministry drew a hard line on Hormuz. Not a coincidence.
Brent crude oil price sits near $89 a barrel and WTI crude oil price is holding above $82, based on Vantage CFD pricing captured at 03:33 UTC (11:33 GMT+8) on 11 August 2026. Both crude oil prices today have clawed back almost everything they gave up last week, and the reason has not changed: the Strait of Hormuz.¹ Iran and Oman are reportedly in the final stages of a framework covering shipping lanes through the strait,³ but Tehran has been explicit that a shipping-lane agreement is not the same thing as a full return to normal transit.¹
This piece reads the oil price chart for both Oil CFD benchmarks and lays out the levels traders are watching. Nothing here is a trade call or a price prediction; every figure is a past or present reading.
What the Oil Price Chart Is Showing Today
WTI Crude Oil Price: Back Above Both Moving Averages
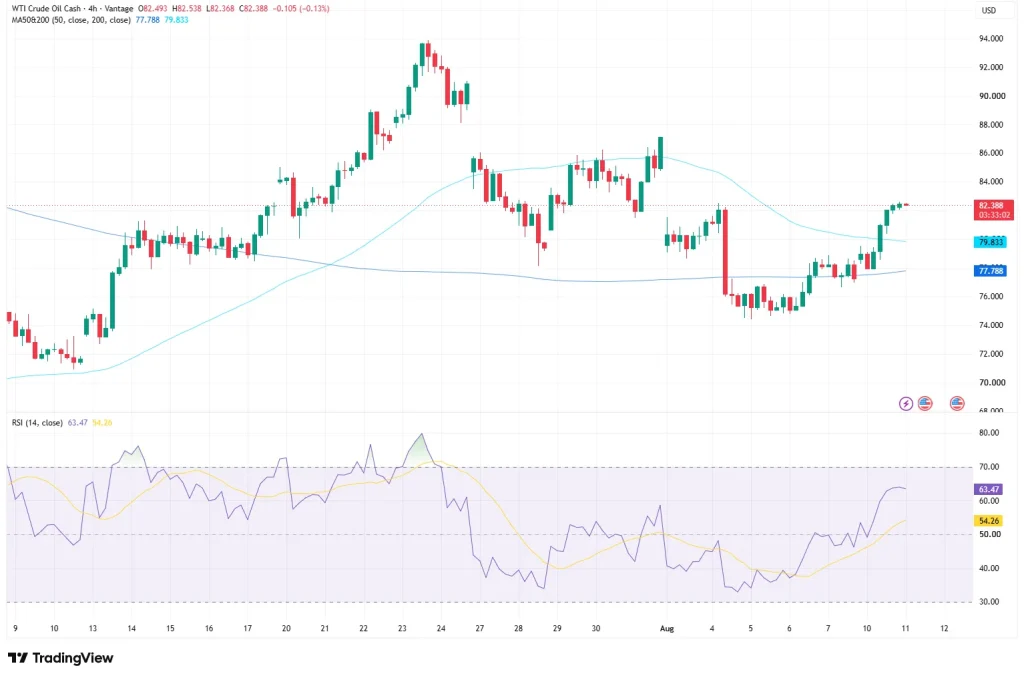
On the 4-hour chart, the Vantage WTI Crude Oil CFD closed the 03:33 UTC (11:33 GMT+8) candle on 11 August 2026 at $82.39, down $0.11, or 0.13%. The candle ranged from $82.37 to $82.54. Price sits above both the 50-period moving average at $77.79 and the 200-period moving average at $79.83 – a structure that has held since the recovery began. The RSI(14) reading on the TradingView setup used for this analysis is 63.47, above its signal line at 54.26. Firm, not stretched; there is a difference. WTI-linked crude is also trading roughly a quarter above where it sat a year ago.¹⁰
That early-August dip followed a larger move: a climb from the low $70s in mid-July to a peak near $94 on 23-24 July, a week consolidating in an $82-$86 range, then a sharp drop to around $75 on 4-5 August, followed by the recovery to current levels.
Brent Oil Price: Closing in on Its Late-July Highs
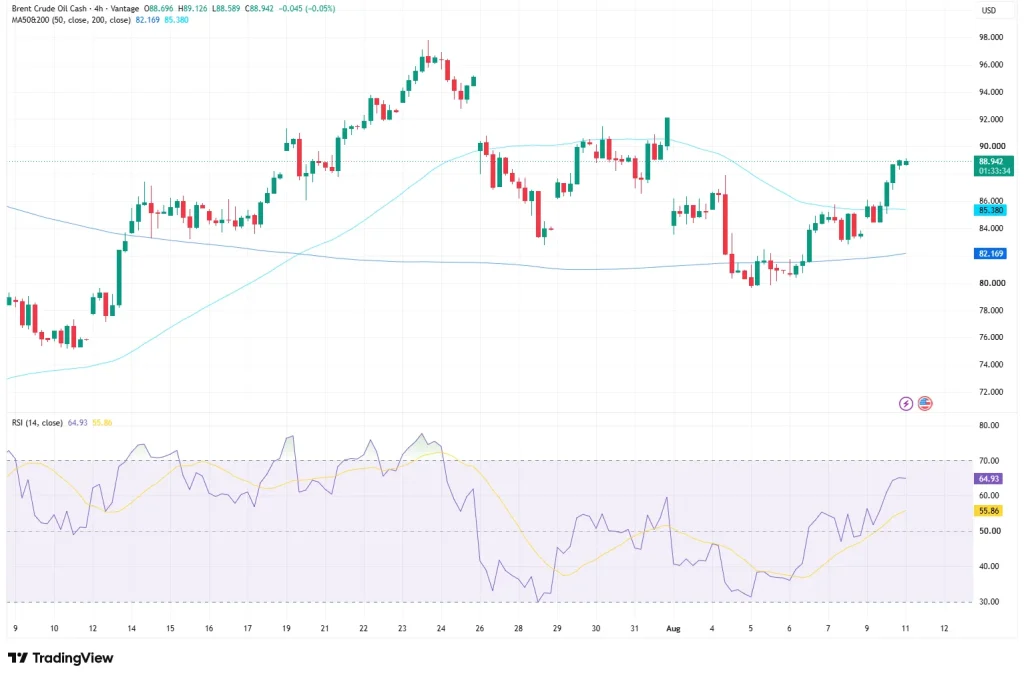
The Vantage Brent Crude Oil CFD closed the 01:33 UTC (09:33 GMT+8) candle on 11 August 2026 at $88.94, down $0.05, or 0.05%, having traded between $88.59 and $89.13. Brent oil also sits above its 50-period moving average at $82.17 and its 200-period moving average at $85.38. The RSI(14) reading on the TradingView setup used for this analysis is 64.93, above the signal line at 55.86 – a near-identical setup to WTI. Two benchmarks, same story, same week. Brent remains well inside its 52-week range of roughly $58.66 to $120.88.⁹
Brent’s broader path mirrors WTI’s: a climb from the high $70s in mid-July to a high near $98 on 23-24 July, a pullback into an $84-$90 range, a fall to roughly $78-$80 on 4-5 August, then the recovery back toward $89.
The Strait of Hormuz Story Still Setting the Tone

Iran’s Foreign Ministry said on 10 August that Washington must lift its naval blockade before Tehran agrees to a full return of normal transit through the strait,¹ even as Iran and Oman work through the final stages of a separate framework on shipping lanes.³ That followed a week in which Brent and WTI had fallen more than 7% on hopes a broader agreement was close, before both turned higher again as the optimism cooled.² Brent futures were still running about 16% above pre-conflict levels as of 10 August, even after that pullback and rebound.⁸ Markets do not love ambiguity.
The stand-off traces back to a memorandum of understanding that the US and Iran signed on 18 June 2026, intended to end the conflict and restore normal shipping through the strait.⁴ That memorandum did not hold: fighting broke out over which routes vessels could use, and the US reimposed its naval blockade after attacks on tankers.¹ Houthi militants in Yemen have separately claimed an attack on a Saudi Arabian refinery, and a tanker operated by an Abu Dhabi state oil firm came under attack in the strait over the weekend.⁵
The stakes are structural. The strait carries roughly a quarter of the world’s seaborne crude trade, with average daily transits near 138 before the conflict began.⁶ US Strategic Petroleum Reserve holdings have fallen below 300 million barrels, the lowest since 1983.⁵ A framework on shipping lanes is a narrower step than full normalisation of transit. The EIA’s most recent outlook, published before the current run-up, had projected Brent easing toward $74 a barrel in the third quarter of 2026, assuming disruptions faded after the June memorandum.⁴ The gap between that forecast and today’s crude oil news says a lot about how fast this story moves.
Levels to Watch This Week
The table below covers the zones the Vantage CFD charts are showing.
| Instrument | Support | Resistance | What’s happening |
| WTI (Vantage CFD) | 79.83 / 77.79 | 84.00-86.00 / 93.50-94.00 | Holding above both moving averages after the 4-5 August drop |
| Brent (Vantage CFD) | 85.38 / 82.17 | 89.00-90.00 / 97.50-98.00 | Testing the upper end of the post-drop recovery range |
Table 1: Levels as of the 11 August 2026 chart cut-off. Source: Vantage WTI and Brent Crude Oil CFD charts, TradingView. Indicative only.
A few calendar and data points worth tracking:
- EIA Short-Term Energy Outlook, 11 August: the next monthly update lands the same day as this cut-off.⁴
- EIA weekly petroleum inventory report, mid-week: US stock changes remain a reliable near-term input.
- Iran-Oman shipping lane framework: confirmation, or a further delay, would matter more to sentiment than any single data print.⁷
- Strait of Hormuz vessel-transit counts: traffic has run well below the pre-conflict average of 138 daily transits; a move back toward that level would signal easing risk.⁶
Risk Management as Volatility Persists
Whatever the diplomatic outcome, this is a reminder that headline-driven markets can gap on a single line from a foreign ministry statement. Leverage remains a double-edged tool: it can magnify gains and losses equally, and should be sized with that in mind.
A Stop Loss does not prevent a loss; it limits losses to a planned size, which matters when a market has moved several percent in a single session more than once since the conflict began.¹ Traders holding oil exposure alongside correlated positions, such as gold or energy shares, may find it worth reviewing that exposure as a combined book.
Stop Loss placement relative to the levels above is worth revisiting rather than left on default settings from a calmer week. The 50- and 200-period moving averages on both charts have acted as a floor since the recovery began, and that floor has already been tested more than once.
Leverage can just as easily magnify a loss as a gain, and position sizing matters more than usual while the Hormuz story remains unresolved. Every level in this piece is a reference point, not an instruction. Here’s why position sizing is one of the decisions with the greatest direct impact on account-level risk, even though it’s the least glamorous part of a plan.
RISK WARNING: CFDs are complex financial instruments and carry a high risk of losing money rapidly due to leverage. You should ensure you fully understand the risks involved and carefully consider whether you can afford to take the high risk of losing your money before trading.
Disclaimer: The information is provided for educational purposes only and doesn’t take into account your personal objectives, financial circumstances, or needs. It does not constitute investment advice. We encourage you to seek independent advice if necessary. The information has not been prepared in accordance with legal requirements designed to promote the independence of investment research. No representation or warranty is given as to the accuracy or completeness of any information contained within. This material may contain historical or past performance figures and should not be relied on. Furthermore estimates, forward-looking statements, and forecasts cannot be guaranteed. The information on this site and the products and services offered are not intended for distribution to any person in any country or jurisdiction where such distribution or use would be contrary to local law or regulation.
References
[1] “Oil prices today: Uncertainty over U.S.-Iran Strait of Hormuz deal – CNBC” https://www.cnbc.com/2026/08/10/oil-prices-today-brent-wti-hormuz-trump-iran.html Accessed on 11 August 2026.
[2] “Oil rises as Iran tempers hopes for swift Hormuz reopening – Reuters via Yahoo Finance” https://finance.yahoo.com/energy/articles/oil-rises-uncertainty-over-reopening-005834869.html Accessed on 11 August 2026.
[3] “Oil Prices Rise on Iran-Oman Deal Hopes Despite Hormuz Stalemate – IBTimes UK” https://www.ibtimes.co.uk/oil-prices-fluctuate-diplomatic-tensions-strait-hormuz-1813271 Accessed on 11 August 2026.
[4] “Short-Term Energy Outlook – U.S. Energy Information Administration” https://www.eia.gov/outlooks/steo/ Accessed on 11 August 2026.
[5] “Brent crude oil – Price, Chart, Historical Data, News – Trading Economics” https://tradingeconomics.com/commodity/brent-crude-oil Accessed on 11 August 2026.
[6] “The Strait of Hormuz: Security Developments and Impacts on Oil, Gas, and Other Commodities – Congress.gov” https://www.congress.gov/crs-product/R45281 Accessed on 11 August 2026.
[7] “Iran and Oman Near Landmark Deal to Manage Strait of Hormuz – OilPrice.com” https://oilprice.com/Latest-Energy-News/World-News/Iran-and-Oman-Near-Landmark-Deal-to-Manage-Strait-of-Hormuz.html Accessed on 11 August 2026.
[8] “Oil prices climb as Iranian demands cloud outlook for Strait of Hormuz – Al Jazeera” https://www.aljazeera.com/economy/2026/8/10/oil-prices-climb-as-iranian-demands-cloud-outlook-for-strait-of-hormuz Accessed on 11 August 2026.
[9] “Crude Oil Price Today: August 7, 2026 – Forbes Advisor” https://www.forbes.com/advisor/investing/oil-prices-today/ Accessed on 11 August 2026.
[10] “Crude Oil – Price, Chart, Historical Data, News – Trading Economics” https://tradingeconomics.com/commodity/crude-oil Accessed on 11 August 2026.
Key Points In This Article

Latest Financial Market News


Market News Tags
- # USD News
- # USDCAD News
- # USDJPY News
- # USDX News
- # Forex News
- # Forex News Today
- # GBPUSD News
- # EURUSD News
- # Currency Trading News
- # AUDUSD news
Related Articles
- US Dollar Index Falls to 98.55 as Yields Ease, Fed Splits
- [DAILY TRADING] Pfizer Stock Price Today 21 August 2026 – $27.82 After CEO’s $1M Share Purchase
- [DAILY TRADING] AUD/USD Analysis 21 August 2026 — AUD/USD Hits 0.7150 as Dollar Slides, Aussie Jobs Miss
- [DAILY TRADING] Nasdaq 100 21 August 2026 – Climbs Back to 29,347 as Wall Street Waits on Jackson Hole
- PLTR Stock Price Today: August 2026 Chart Breakout & Key Levels
- [DAILY TRADING] Oracle Stock 21 August 2026 – ORCL Holds $142 as Pipeline Delay Meets Debt Fears
- [DAILY TRADING]: EUR/USD Analysis 21 August 2026 — EUR/USD Holds 1.1697, Near 3-Month High, ECB Hike Bets Firm
- [DAILY TRADING] Alibaba 21 August 2026 – BABA Stock Price Rebounds to $130.57 After Earnings Miss