
-

-


Download App
-


-

-

-
Search query too short. Please enter a full word or phrase.
-

Keywords
- Forex Trading
- Vantage Rewards
- Spreads
Popular Search
- Trading Accounts
- MT4
- MT5
- Copy Trading
- Promotions





Language


Brent Crude Oil NewsCommodities NewsCommodity Market NewsCrude Oil News TodayEconomic News TodayFeatured NewsIran NewsOil NewsOil Price News TodayTechnical analysisTrending NewsVantage NewsWTI Crude OIl News
Brent and WTI Crude Oil: Trump’s Iran Pause Shakes Markets

Vantage Editorial Team >
4 August 2026 | Market Analysis | 11 min read
Vantage Editorial Team >
Vantage is a global, multi-asset broker with a team of in-house writers and market analysts who produce educational and insightful trading content for traders of all levels.
Crude oil prices just gave traders a case of whiplash. Brent and WTI both slid more than 5% on 3 August after US President Donald Trump said he was holding off a planned strike on Iran to give fresh talks a chance1, and that’s the kind of headline that moves a market fast. This analysis reflects pricing as of 14:00 (GMT+8) on 4 August 2026, based on the Vantage UKOUSD and USOUSD CFD charts. A day on, both benchmarks have caught their breath. They’re trading well below last month’s highs, but still comfortably above where this latest slide began.
What’s Actually Moving the Crude Oil Price This Week
Trump said on 3 August that Saudi Arabia and other Gulf allies had asked him to pause a planned attack on Iran while negotiations continue1, and oil did what oil does on that kind of news: it fell, hard. Brent crude futures were down $4.49, or 5.11%, to 83.44 a barrel at 1315 GMT on 3 August, having fallen as much as 7.3% intraday to a three-week low of 81.55 earlier in the session.1,2 WTI dropped $5.39, or 6.37%, to 79.28.1 Both contracts had surged almost a quarter in July, their biggest monthly gain since March.2
Here’s the catch: Iran said flatly on 3 August that no talks with Washington were under way and none were planned, directly contradicting Trump’s own justification for calling off the strikes.1 The physical picture hasn’t actually eased either. Ship-tracking data cited by Reuters showed six Saudi-flagged supertankers rerouting via southern Africa to avoid Houthi threats in the Gulf of Aden, while UK Maritime Trade Operations reported three tanker attacks since the preceding Saturday.1
Kazakhstan’s crude and condensate output fell to about 1.85 million barrels a day in July from 2.16 million in June, linked to repeated disruptions at the Caspian Pipeline Consortium, its main export route.1 As Reuters put it, export disruptions from the Gulf, Russia, and Kazakhstan have meant successive monthly OPEC+ output hikes this year haven’t actually translated into extra oil reaching the market.1
On the supply side, OPEC+’s seven core producers, including Saudi Arabia and Russia, said in a statement following their 2 August meeting that they’d raise output by a further 188,000 barrels per day, effective September.3 The move completes the group’s unwind of the voluntary cuts it first introduced in 2023, though whether it changes much in practice is another question given the disruptions above.1,3
Trump also weighed in on oil company profits on 3 August, saying major producers were “making too much money” and should cut retail prices, remarks aimed at Chevron and ExxonMobil after both reported sharply higher second-quarter earnings the week before.4 That’s a separate story from the crude price move, but it added noise to an already jumpy session. None of this tells us where Brent or WTI head next. It’s simply the backdrop this week’s chart is trading against. It’s a story that sits at the crossroads of Vantage’s Iran News and Market Sell-Off tags, alongside the dedicated Brent Crude Oil News and WTI Crude Oil News pages, for anyone tracking this one further.
Brent Crude Oil Price (UKOUSD): Reading the Chart
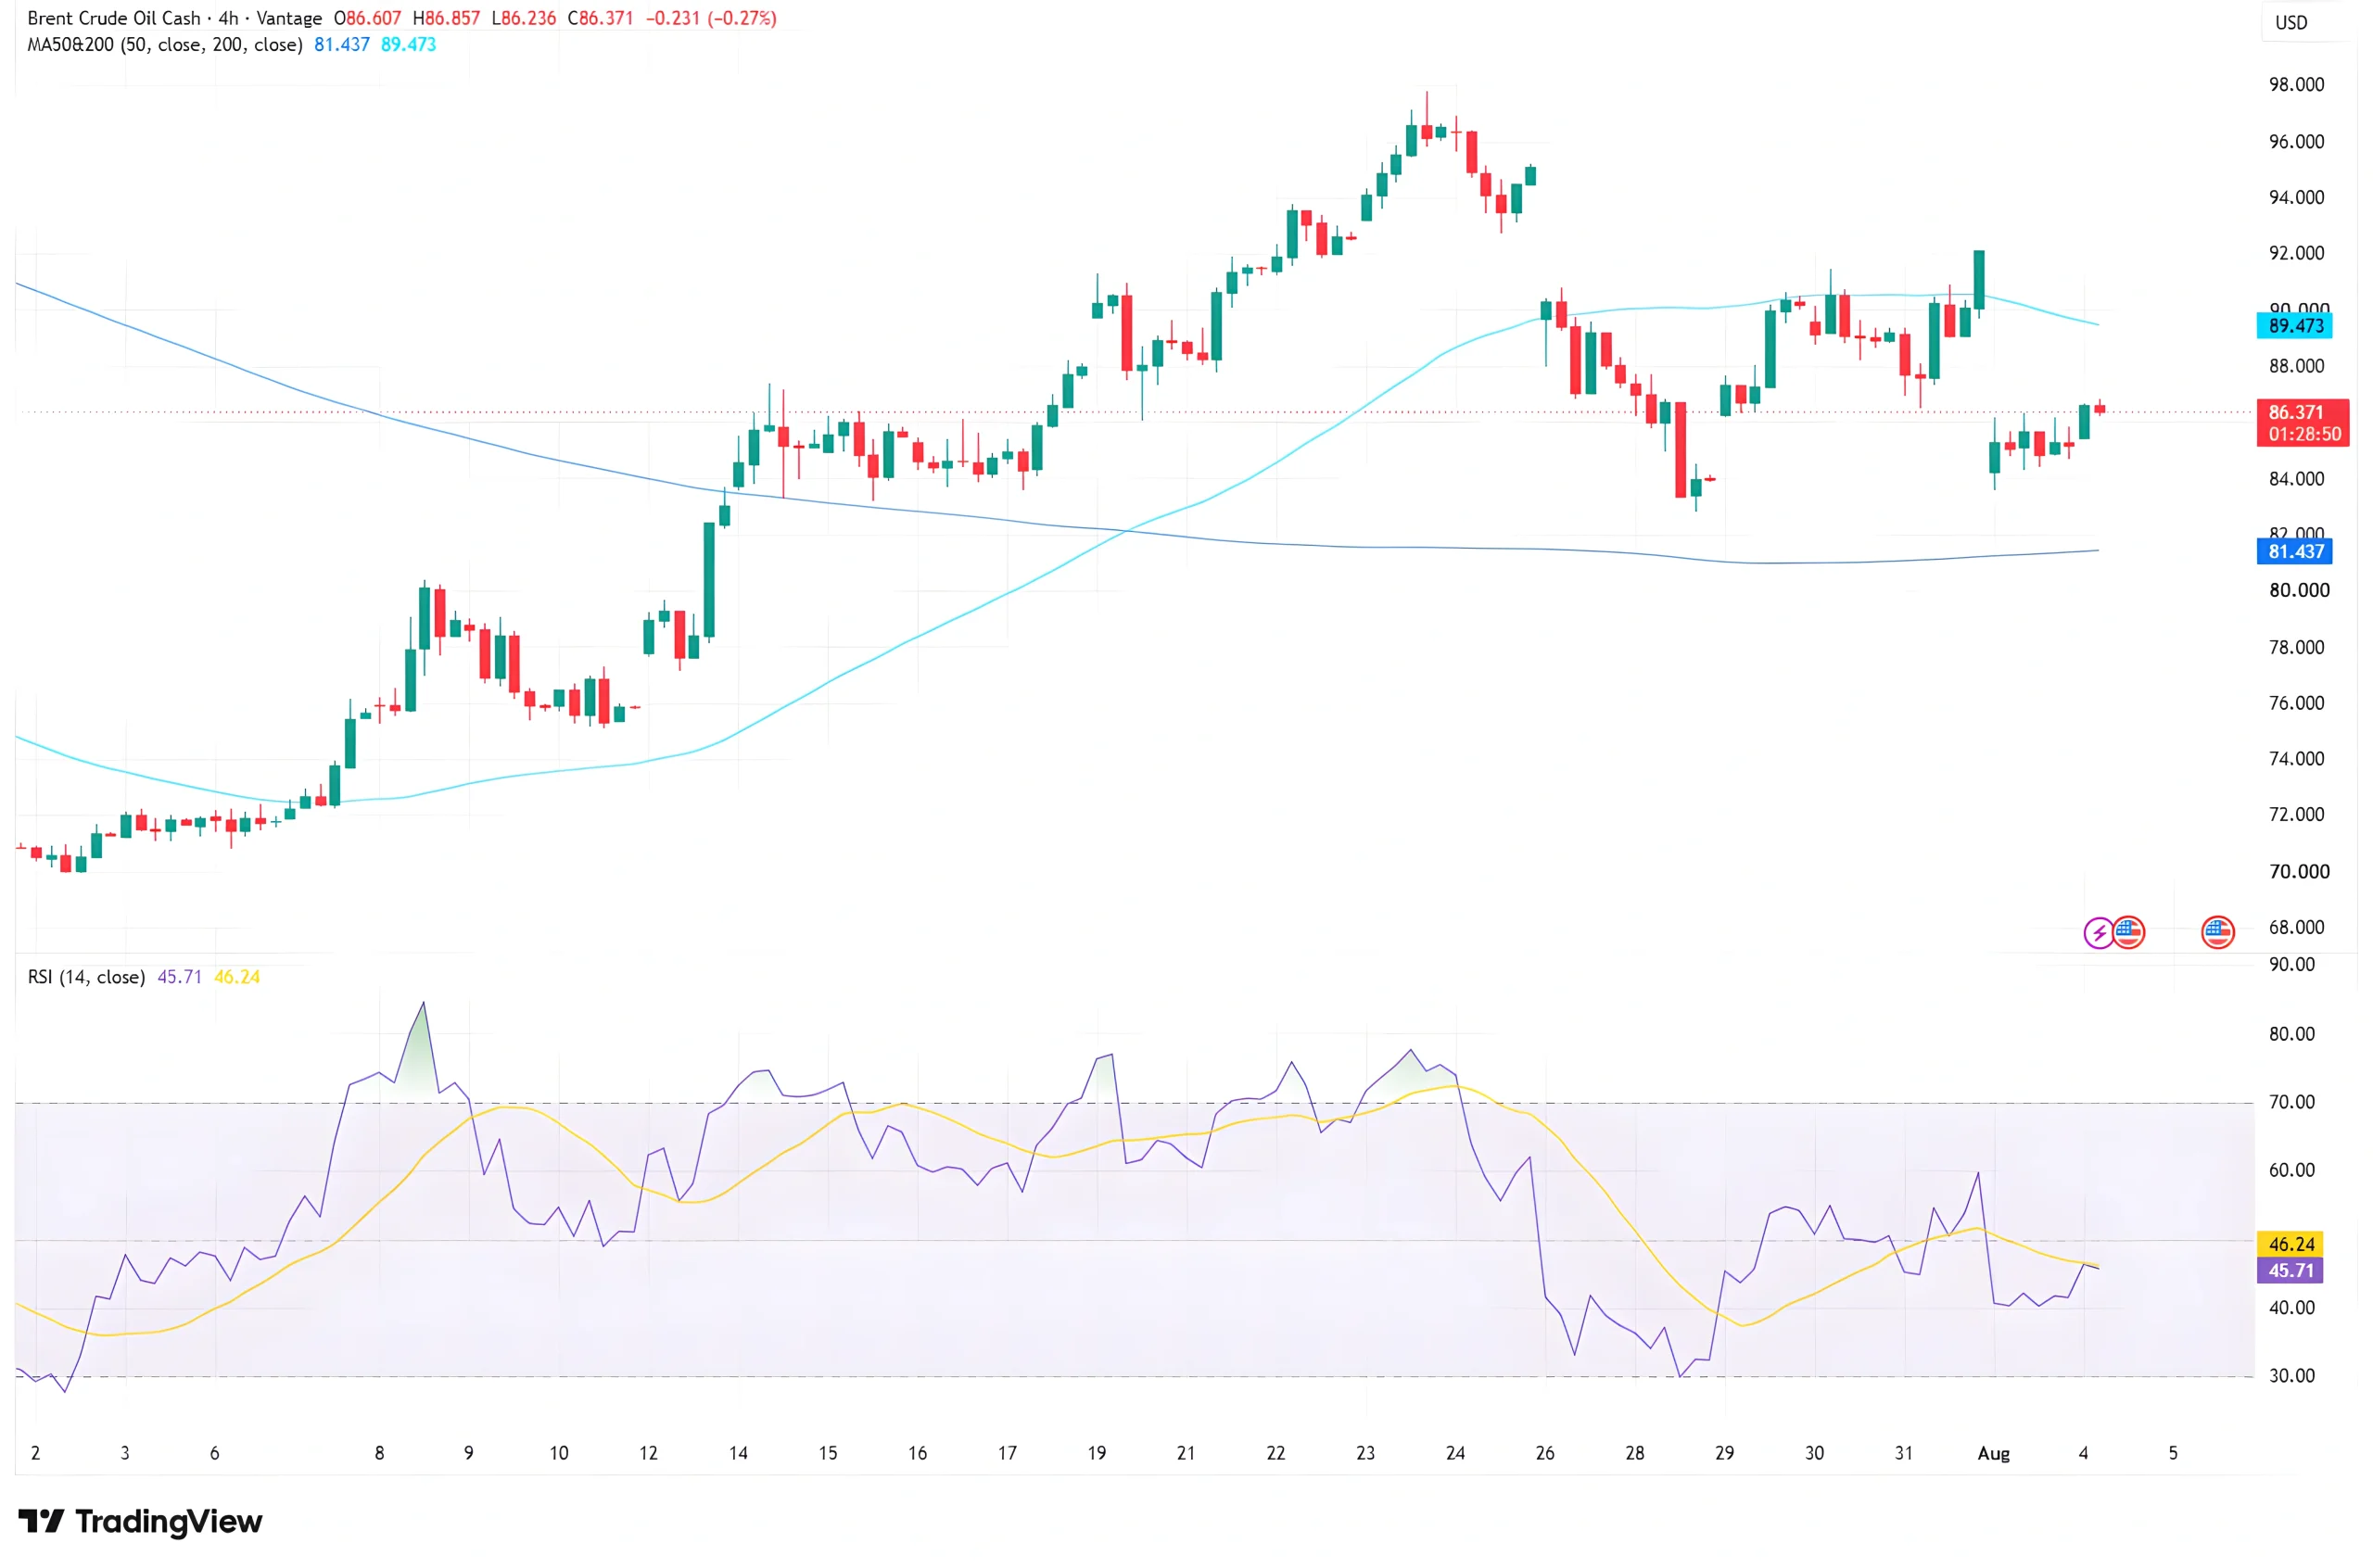
The Vantage Brent Crude Oil CFD last traded at 86.371, down 0.27% on the session, after opening at 86.607 and swinging between 86.236 and 86.857 over the four-hour candle that closed at 01:28 on 4 August 2026 (see Figure 1).
Zoom out on the oil price chart and Brent is sitting in a squeeze between two moving averages: a 50-period line near 81.44 acting as a floor, and a 200-period line near 89.47 acting as a lid. Price has held above the shorter average since around 19 July and below the longer one since the July rally ran out of steam, boxing Brent into that band for close to two weeks. Before that, the chart traces a round trip: a climb from the low 70s in early July to a peak close to 98 by 23-24 July, a fast pullback to the mid-80s, a brief push toward 90 into month-end, and now this latest leg lower.
The RSI on the TradingView setup used for this analysis reads 45.71 against a 46.24 signal average, both just under the neutral 50 line. Translation: the selling has stalled, but nothing’s built fresh momentum in either direction yet either. It’s a market catching its breath, not one that’s made up its mind. Readers newer to this indicator can find a fuller explanation in the Vantage forex and CFD risk management guide.
WTI Crude Oil Price (USOUSD): Reading the Chart
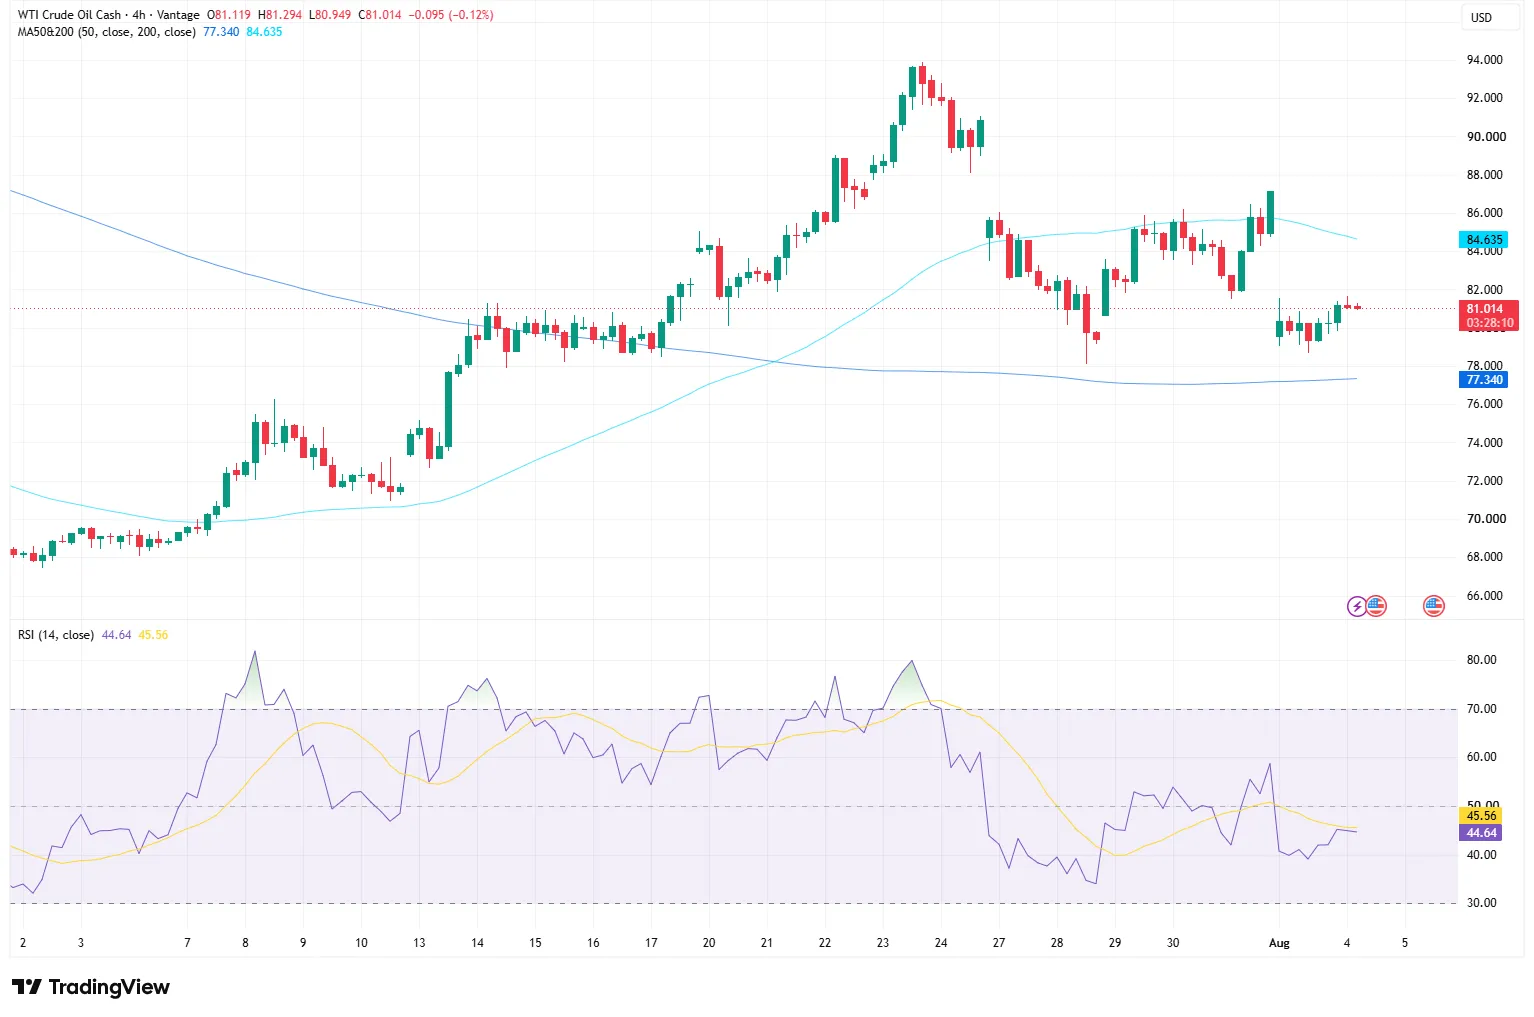
The Vantage WTI Crude Oil CFD last traded at 81.014, down 0.12% on the session, after opening at 81.119 and ranging between 80.949 and 81.294 over the same four-hour window, ending at 03:28 on 4 August 2026 (see Figure 2).
WTI is boxed in the same way Brent is. Its 50-period average sits near 77.34, well below current price, while the 200-period average sits higher at 84.64. Price has spent most of the past two weeks trading in that gap, tracing the same round trip from the mid-70s in early July to a peak above 93 in late July, then back down through the first days of August. Brent and WTI have moved almost hand in hand through this cycle, typical when the driver is a shared geopolitical story rather than something grade-specific.
RSI on the TradingView setup used for this analysis reads 44.64 against a 45.56 signal average, both just under 50. Same story as Brent: a market pausing to digest a fast move rather than one that’s picked a lane.
Levels to Watch and Risk Considerations
| Instrument | Near-Term Floor (50 MA) | Overhead Level (200 MA) | What’s Happening |
| UKOUSD (Brent) | 81.44 | 89.47 | Consolidating inside the band since the late-July reversal |
| USOUSD (WTI) | 77.34 | 84.64 | Same range-bound pattern, tracking Brent closely |
Table 1: Near-term floor and overhead levels for Brent (UKOUSD) and WTI (USOUSD), based on the 50- and 200-period moving averages on the Vantage 4-hour charts. Data as of 4 August 2026.
Both oil price charts are currently parked between their short and long-term moving averages, a zone that’s acted as a rough consolidation range since the last week of July. Brent’s 52-week range still spans a wide 58.72 to 126.41 a barrel,5 a reminder of how far this year’s Middle East-driven volatility has stretched the normal trading band. Whether the current range holds probably comes down to what happens next in the region and whether OPEC+’s latest increase actually reaches the market, not the technical picture alone. For the fuller picture on how each benchmark is priced, Vantage has deeper guides on trading Brent crude oil and trading WTI crude oil, plus the broader Vantage oil trading page for how oil CFDs work and what typically moves crude oil prices day to day.
With Brent and WTI both trapped between their 50- and 200-period averages, sharp headline-driven swings are the rule right now, not the exception. A Stop Loss placed with that moving-average band in mind, rather than at an arbitrary distance, keeps exposure aligned with where the chart is actually showing structure. Anyone holding correlated positions across Brent, WTI, and other Middle East-sensitive instruments should check their combined exposure, since one regional headline has been enough to move all of them together this week.
Leverage remains a double-edged tool in a market that’s swung more than 5% in a single session. It magnifies gains and losses equally, in both directions. Position sizing relative to account equity, rather than a fixed lot size, is worth revisiting given how far both benchmarks have moved this month. For Crude Oil News Today and ongoing coverage, the Vantage Oil News and Commodity Market News tags track UKOUSD and USOUSD as the story develops.
RISK WARNING: CFDs are complex financial instruments and carry a high risk of losing money rapidly due to leverage. You should ensure you fully understand the risks involved and carefully consider whether you can afford to take the high risk of losing your money before trading.
Disclaimer: The information is provided for educational purposes only and doesn’t take into account your personal objectives, financial circumstances, or needs. It does not constitute investment advice. We encourage you to seek independent advice if necessary. The information has not been prepared in accordance with legal requirements designed to promote the independence of investment research. No representation or warranty is given as to the accuracy or completeness of any information contained within. This material may contain historical or past performance figures and should not be relied on. Furthermore estimates, forward-looking statements, and forecasts cannot be guaranteed. The information on this site and the products and services offered are not intended for distribution to any person in any country or jurisdiction where such distribution or use would be contrary to local law or regulation.
References
[1] “Oil prices drop after Trump cancels attack on Iran to seek deal – Reuters via Yahoo Finance” https://finance.yahoo.com/energy/articles/oil-tumbles-trump-cancels-attack-041829322.html Accessed on 4 August 2026.
[2] “Oil Slumps as Trump Holds Off Iran Attack as Talks to Resume – Bloomberg” https://www.bloomberg.com/news/articles/2026-08-02/latest-oil-market-news-and-analysis-for-aug-3 Accessed on 4 August 2026.
[3] “2 August 2026 Statement – Organization of the Petroleum Exporting Countries” https://www.opec.org/pr-detail/1854611-2-august-2026.html Accessed on 4 August 2026.
[4] “Trump Hits Exxon, Chevron for Profits Amid Iran War He Launched – Bloomberg” https://www.bloomberg.com/news/articles/2026-08-03/trump-hits-exxon-chevron-for-profits-amid-iran-war-he-launched Accessed on 4 August 2026.
[5] “Brent Crude Oil Futures Price Today – Investing.com” https://www.investing.com/commodities/brent-oil Accessed on 4 August 2026.
Key Points In This Article

Latest Financial Market News


Market News Tags
- # USD News
- # USDCAD News
- # USDJPY News
- # USDX News
- # Forex News
- # Forex News Today
- # GBPUSD News
- # EURUSD News
- # Currency Trading News
- # AUDUSD news
Related Articles
- US Dollar Index Falls to 98.55 as Yields Ease, Fed Splits
- [DAILY TRADING] Pfizer Stock Price Today 21 August 2026 – $27.82 After CEO’s $1M Share Purchase
- [DAILY TRADING] AUD/USD Analysis 21 August 2026 — AUD/USD Hits 0.7150 as Dollar Slides, Aussie Jobs Miss
- [DAILY TRADING] Nasdaq 100 21 August 2026 – Climbs Back to 29,347 as Wall Street Waits on Jackson Hole
- PLTR Stock Price Today: August 2026 Chart Breakout & Key Levels
- [DAILY TRADING] Oracle Stock 21 August 2026 – ORCL Holds $142 as Pipeline Delay Meets Debt Fears
- [DAILY TRADING]: EUR/USD Analysis 21 August 2026 — EUR/USD Holds 1.1697, Near 3-Month High, ECB Hike Bets Firm
- [DAILY TRADING] Alibaba 21 August 2026 – BABA Stock Price Rebounds to $130.57 After Earnings Miss