
-

-


Download App
-


-

-

-
Search query too short. Please enter a full word or phrase.
-

Keywords
- Forex Trading
- Vantage Rewards
- Spreads
Popular Search
- Trading Accounts
- MT4
- MT5
- Copy Trading
- Promotions





Language

 Market Analysis Daily Analysis [DAILY TRADING] AUDUSD Analysis 4 August 2026 – The Aussie Can’t Pick a Lane
AUDUSD newsCurrency Trading NewsEconomic News TodayFeatured NewsFederal Reserve NewsFinancial NewsForex NewsForex News TodayInterest Rate NewsMarket News TodayTechnical analysisTrending NewsVantage News
[DAILY TRADING] AUDUSD Analysis 4 August 2026 – The Aussie Can’t Pick a Lane

Vantage Editorial Team >
4 August 2026 | Daily Analysis | 9 min read
Vantage Editorial Team >
Vantage is a global, multi-asset broker with a team of in-house writers and market analysts who produce educational and insightful trading content for traders of all levels.

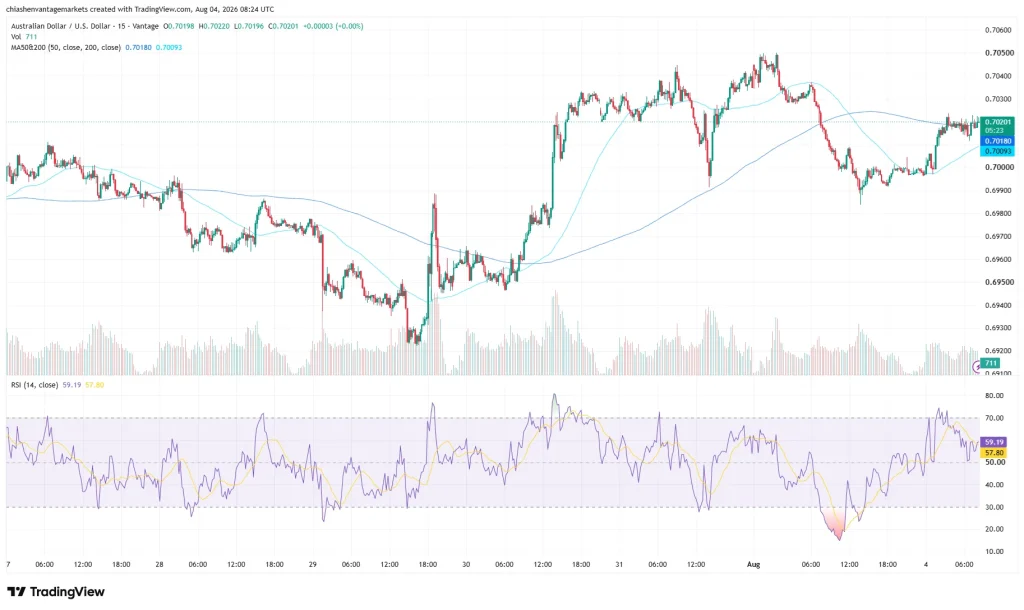
AUD/USD spent the past week trading in a volatile but ultimately range-bound pattern. The pair bounced from below 0.6920 to above 0.7050, trading near 0.7014 as of 06:57 UTC on 4 August 2026, sitting almost exactly between its 50-period moving average (0.70184) and 200-period moving average (0.70069) on the Vantage AUDUSD CFD feed, a pattern consistent with consolidation rather than a clear trend.
However you write it, AUD/USD, AUD to USD, AUD USD, USD AUD, or AUD v USD, the AUDUSD forecast picture has not cleared up, and the AUD to USD conversion rate shows why. A divided Federal Reserve, a cooling US labour market, a Chinese factory sector back in contraction, and a sliding US Dollar Index are all still in play.
Charts are indicative and from TradingView. This is not financial advice.
Key Points
- AUD/USD trades near 0.7014 as of 06:57 UTC, 4 August 2026, caught between its 50-period MA (0.70184) and 200-period MA (0.70069) on the Vantage feed.
- The US Dollar Index has eased for a fifth straight session on Fed uncertainty, a cooling US labour market, and renewed expectations that Japanese authorities could intervene to support the yen.
- China’s official manufacturing PMI fell into contraction at 49.2 in July, a headwind for the Aussie that broad Dollar weakness is offsetting for now.
What the AUDUSD chart is showing
On the 15-minute AUDUSD TradingView chart, the pair opened the week near 0.6980, slid to a multi-day low around 0.6905 to 0.6920 by 29 July, then reversed hard into a multi-day high just above 0.7050 by 31 July. From there it faded into a 0.6980 to 0.7030 range before climbing again into today’s session, reflecting a volatile but ultimately range-bound market.
The 50-period MA (0.70184) now sits just above spot, the 200-period MA (0.70069) just below it, pointing to consolidation rather than a clean breakout. The RSI, attributed to the TradingView setup used for this analysis, backs that up: it swung from oversold below 20 on 2 August to overbought above 78, before easing to a neutral 51.24, signal average 61.02. Volume on the Vantage CFD feed printed 1.01K on the latest candle. Whether reading the AUDUSD chart or the AUD to USD chart, the broader AUDUSD trend still looks sideways.
The macro backdrop

The Federal Reserve held its benchmark rate at 3.50% to 3.75% on 29 July in a 9-3 vote,[1] with three regional presidents, Beth Hammack, Neel Kashkari, and Lorie Logan, dissenting in favour of a hike on inflation that has stayed above target too long.[2] The statement flagged uncertainty tied partly to the Middle East conflict, and Chair Kevin Warsh stayed vague on next steps.
That followed a soft jobs report: Nonfarm payrolls rose just 57,000 in June, short of the roughly 115,000 expected, while unemployment eased to 4.2%.[3] Australia looks steadier: employment rose 76,300 in June, mostly part-time, while unemployment held at 4.4%, per the Australian Bureau of Statistics.[4] The RBA’s cash rate sits at 4.35% after three hikes this year.[5]
China’s factory activity slipped into contraction, official manufacturing PMI down to 49.2 in July from 50.3 in June.[6] Since China is Australia’s largest trading partner, that is normally a headwind for the Aussie, although this week’s broad weakness in the US Dollar Index, amid renewed expectations that Japanese authorities could intervene to support the yen, has partially offset that pressure.[7]
Levels to watch
The table below covers the zones traders are watching for the AUD/USD price forecast and the Dollar Index. These are reference levels, not trade signals.
| Pair | Support | Resistance | What’s happening |
| AUDUSD | 0.6905 / 0.6920 | 0.7050 | Consolidating between the 50- and 200-period MAs after last week’s round trip |
| US Dollar Index | 99.50 | 100.95 | Fifth straight session lower, pressured by Fed uncertainty and BOJ intervention speculation |
Table 1: Key levels as of 06:57 UTC, 4 August 2026. Sources: Vantage AUDUSD CFD feed, TradingView, Trading Economics.[7] Indicative only.
The 200-period MA (0.70069) is the nearest level below current price, with the wider multi-day low near 0.6905 to 0.6920 beneath that. On the upside, the 50-period MA (0.70184) comes first, then the 0.7050 high. A daily close outside either zone would break the range since late July.
What to watch today and this week
For anyone tracking AUDUSD news or running their own AUD USD forecast, the calendar is busy:
- US ISM Services PMI, 5 August: a stronger print extends the Dollar’s rebound.
- China Caixin Services PMI, 5 August: another soft print reinforces the cooling-demand story.
- Australia Trade Balance, 6 August: a narrower surplus adds to the commodity-side pressure.
- US Nonfarm Payrolls, 7 August: the week’s biggest event risk for USD pairs.
- RBA Rate Decision, 11 August: markets are positioned for a hold at 4.35%, though that could shift.
With AUD/USD holding inside a range that has already produced two 100-plus pip swings this week, standard intraday assumptions may be less reliable than usual. Because sharp macro releases can generate gaps and rapid volatility, traders often review position sizing and overall risk exposure around the 0.6905-0.6920 support zone and the 0.7050 resistance area.
Leverage remains a double-edged tool in a data-heavy week. Position sizing is worth revisiting ahead of Friday’s payrolls print and next week’s RBA decision, key inputs to any AUD to USD forecast or currency forecast AUD to USD.
RISK WARNING: CFDs are complex financial instruments and carry a high risk of losing money rapidly due to leverage. You should ensure you fully understand the risks involved and carefully consider whether you can afford to take the high risk of losing your money before trading.
Disclaimer: The information is provided for educational purposes only and doesn’t take into account your personal objectives, financial circumstances, or needs. It does not constitute investment advice. We encourage you to seek independent advice if necessary. The information has not been prepared in accordance with legal requirements designed to promote the independence of investment research. No representation or warranty is given as to the accuracy or completeness of any information contained within. This material may contain historical or past performance figures and should not be relied on. Furthermore estimates, forward-looking statements, and forecasts cannot be guaranteed. The information on this site and the products and services offered are not intended for distribution to any person in any country or jurisdiction where such distribution or use would be contrary to local law or regulation.
References
[1] “Federal Reserve issues FOMC statement” – Board of Governors of the Federal Reserve System. https://www.federalreserve.gov/newsevents/pressreleases/monetary20260729a.htm Accessed on 4 August 2026.
[2] “Fed rate decision July 2026: Divided Fed holds interest rates steady” – CNBC. https://www.cnbc.com/2026/07/29/fed-rate-decision-july-2026.html Accessed on 4 August 2026.
[3] “Employment Situation Summary – June 2026” – US Bureau of Labor Statistics. https://www.bls.gov/news.release/empsit.htm Accessed on 4 August 2026.
[4] “Labour Force, Australia, June 2026” – Australian Bureau of Statistics. https://www.abs.gov.au/statistics/labour/employment-and-unemployment/labour-force-australia/latest-release Accessed on 4 August 2026.
[5] “Reserve Bank of Australia” – Monetary Policy Decision schedule. https://www.rba.gov.au/ Accessed on 4 August 2026.
[6] “China’s factory activity unexpectedly contracts in July on demand slump, typhoons” – CNBC. https://www.cnbc.com/2026/07/31/china-pmi-factory-activity-economic-growth-exports-.html Accessed on 4 August 2026.
[7] “United States Dollar – Quote – Chart – Historical Data – News” – Trading Economics. https://tradingeconomics.com/united-states/currency Accessed on 4 August 2026.
Key Points In This Article

Latest Financial Market News


Market News Tags
- # USD News
- # USDCAD News
- # USDJPY News
- # USDX News
- # Forex News
- # Forex News Today
- # GBPUSD News
- # EURUSD News
- # Currency Trading News
- # AUDUSD news
Related Articles
- US Dollar Index Falls to 98.55 as Yields Ease, Fed Splits
- [DAILY TRADING] Pfizer Stock Price Today 21 August 2026 – $27.82 After CEO’s $1M Share Purchase
- [DAILY TRADING] AUD/USD Analysis 21 August 2026 — AUD/USD Hits 0.7150 as Dollar Slides, Aussie Jobs Miss
- [DAILY TRADING] Nasdaq 100 21 August 2026 – Climbs Back to 29,347 as Wall Street Waits on Jackson Hole
- PLTR Stock Price Today: August 2026 Chart Breakout & Key Levels
- [DAILY TRADING] Oracle Stock 21 August 2026 – ORCL Holds $142 as Pipeline Delay Meets Debt Fears
- [DAILY TRADING]: EUR/USD Analysis 21 August 2026 — EUR/USD Holds 1.1697, Near 3-Month High, ECB Hike Bets Firm
- [DAILY TRADING] Alibaba 21 August 2026 – BABA Stock Price Rebounds to $130.57 After Earnings Miss