
 Register
 Login
 Register





Markets to Watch This Week: AUD/USD, Brent Crude Oil and Gold

Hebe Chen >
Senior Market Analyst
Hebe Chen >
Senior Market Analyst
 Updated Wed, 2025 June 18 05:02

Global markets are stepping into a packed week—one shaped not only by renewed geopolitical tensions but also by a flurry of key central bank decisions and high-stakes economic data.
Tensions in the Middle East returns to front and centre after Israel’s strike on Iranian nuclear sites last Friday, reigniting heightened fears of a broader regional conflict.
Still, the real spotlight shifts to central banks this week. The Bank of Japan kicked things off on Tuesday, holding rates steady at 0.5% as widely expected, while reaffirming its tapering plan through March 2026 and signalling a slower pace of JGB reductions from April 2026—a clear step toward gradual policy normalization.The action continues with policy updates from the Fed, PBoC, and BoE later this week. While no rate moves are anticipated, any shift in tone or forward guidance will be closely scrutinized.
On the data front, watch for U.S. retail sales and industrial production, Australia’s employment report, and key economic figures out of China and Japan.
Against this busy backdrop, here are three markets on our radar in the days ahead:
AUD/USD
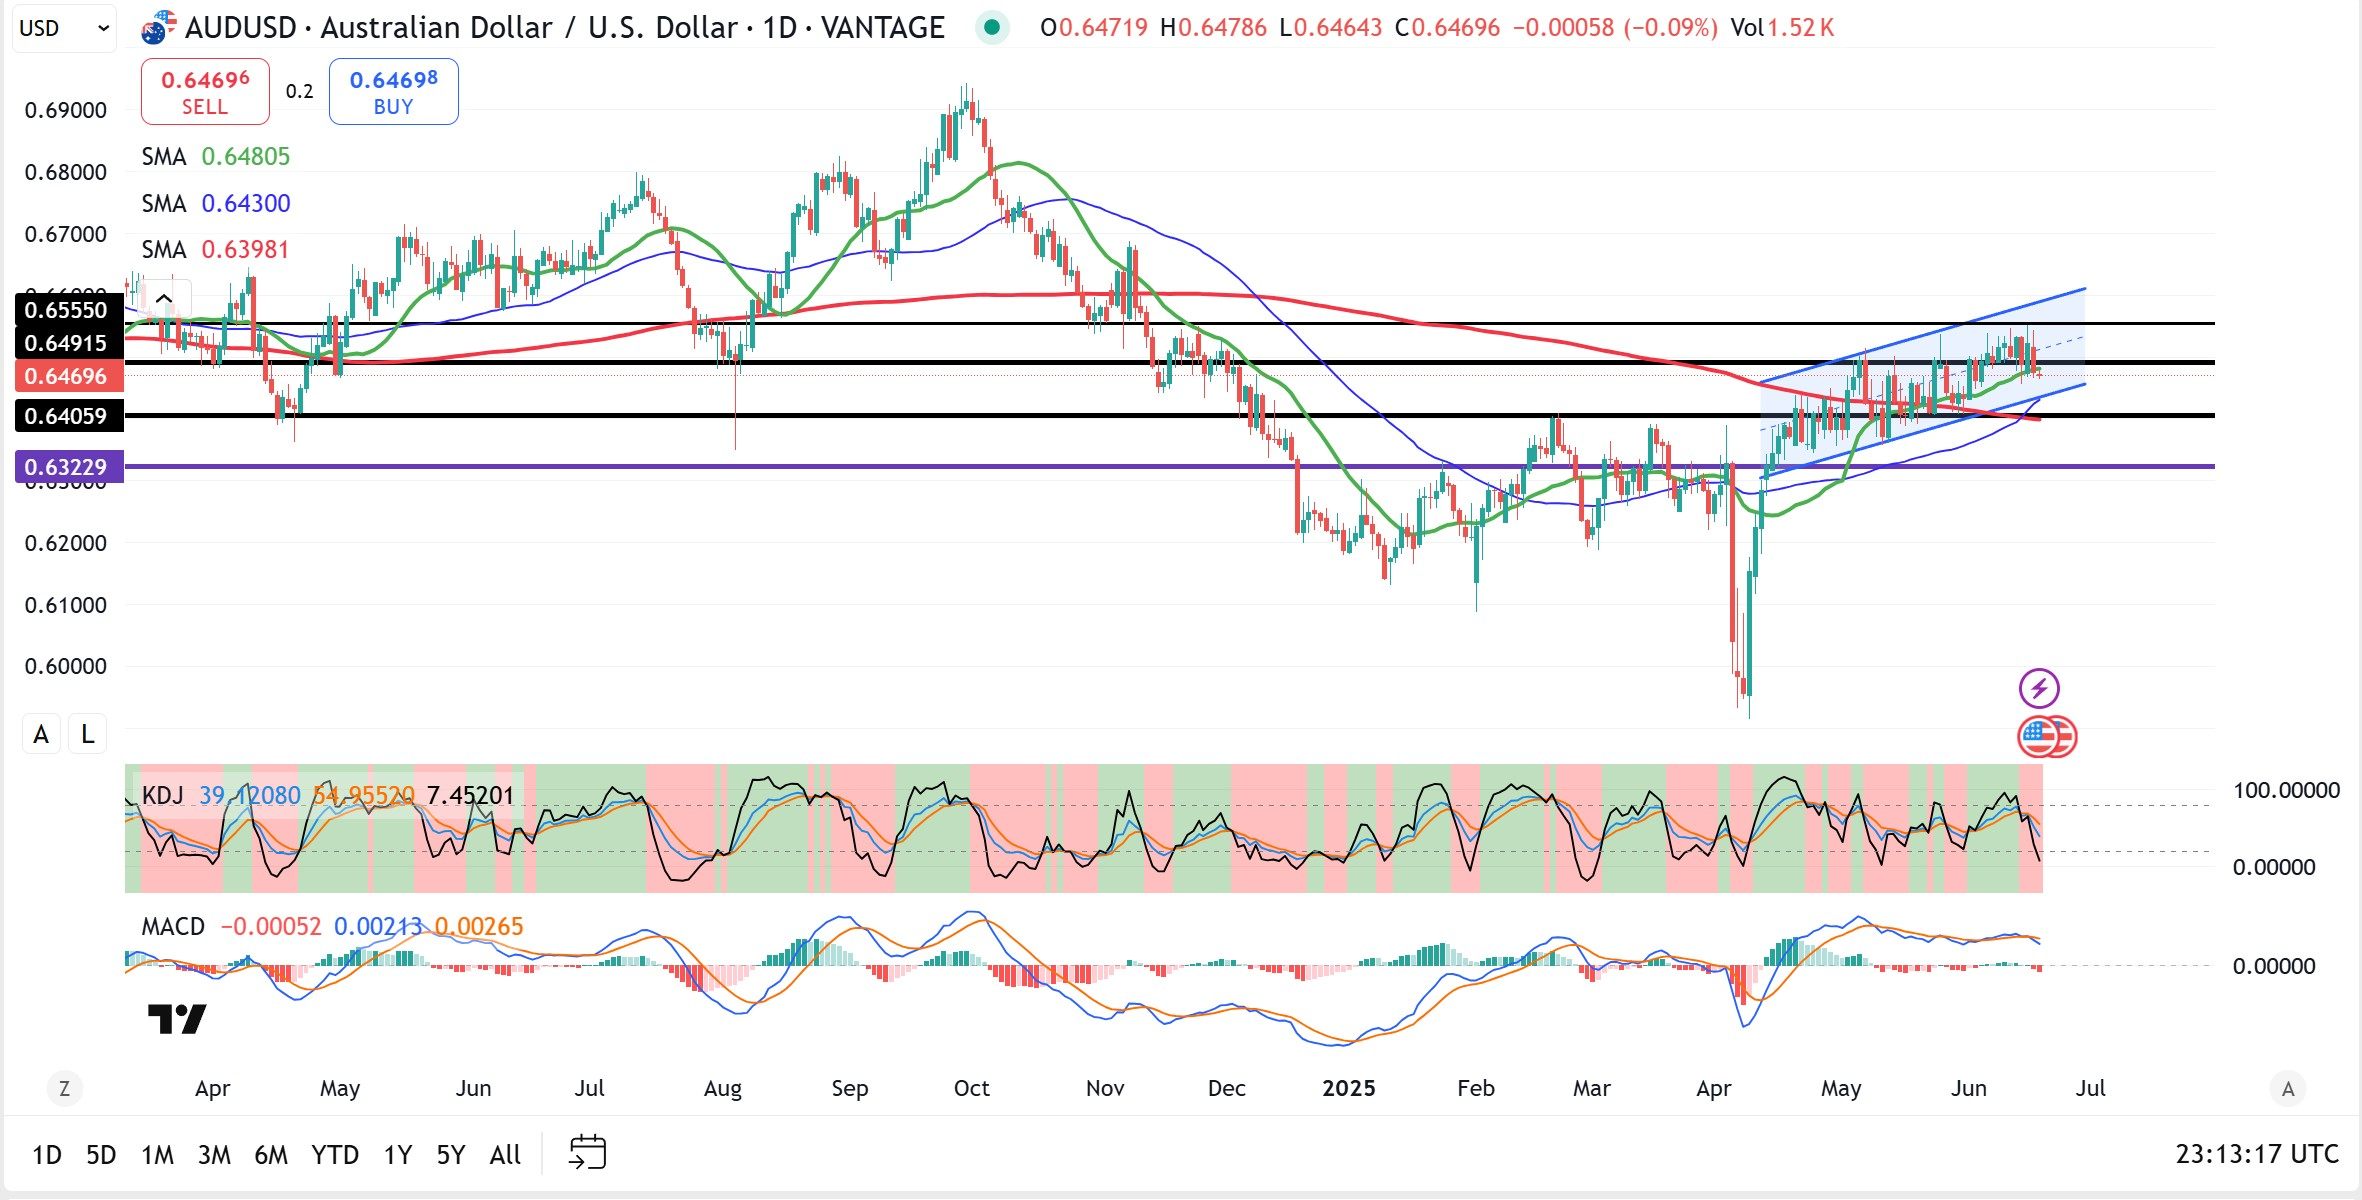
AUD/USD remains in a mild uptrend within a rising channel, but momentum is showing early signs of fatigue. Key near-term support sits at 0.6436 and 0.6400—both aligning with the lower channel boundary and 50-day SMA. Resistance caps near 0.6530 and 0.6555.
The KDJ indicator is turning lower from overbought territory, hinting at fading bullish momentum. MACD shows a flat bias, reflecting indecision.
While the pair stays above the 200-day SMA and within the ascending channel, the mid-term structure remains constructive. However, a break below 0.6405 would suggest a short-term pullback.
Brent Crude Oil
Oil prices surged another 4% on Tuesday, clawing back Monday’s losses as fresh geopolitical flare-ups renewed supply fears. Market sentiment flipped after U.S. President Trump escalated rhetoric against Iran, demanding “unconditional surrender” and directly targeting Supreme Leader Khamenei in a series of posts—undermining earlier hopes of a ceasefire between Iran and Israel. By the time of writing (June 18th), oil prices have jumped up more than 20% in June only.
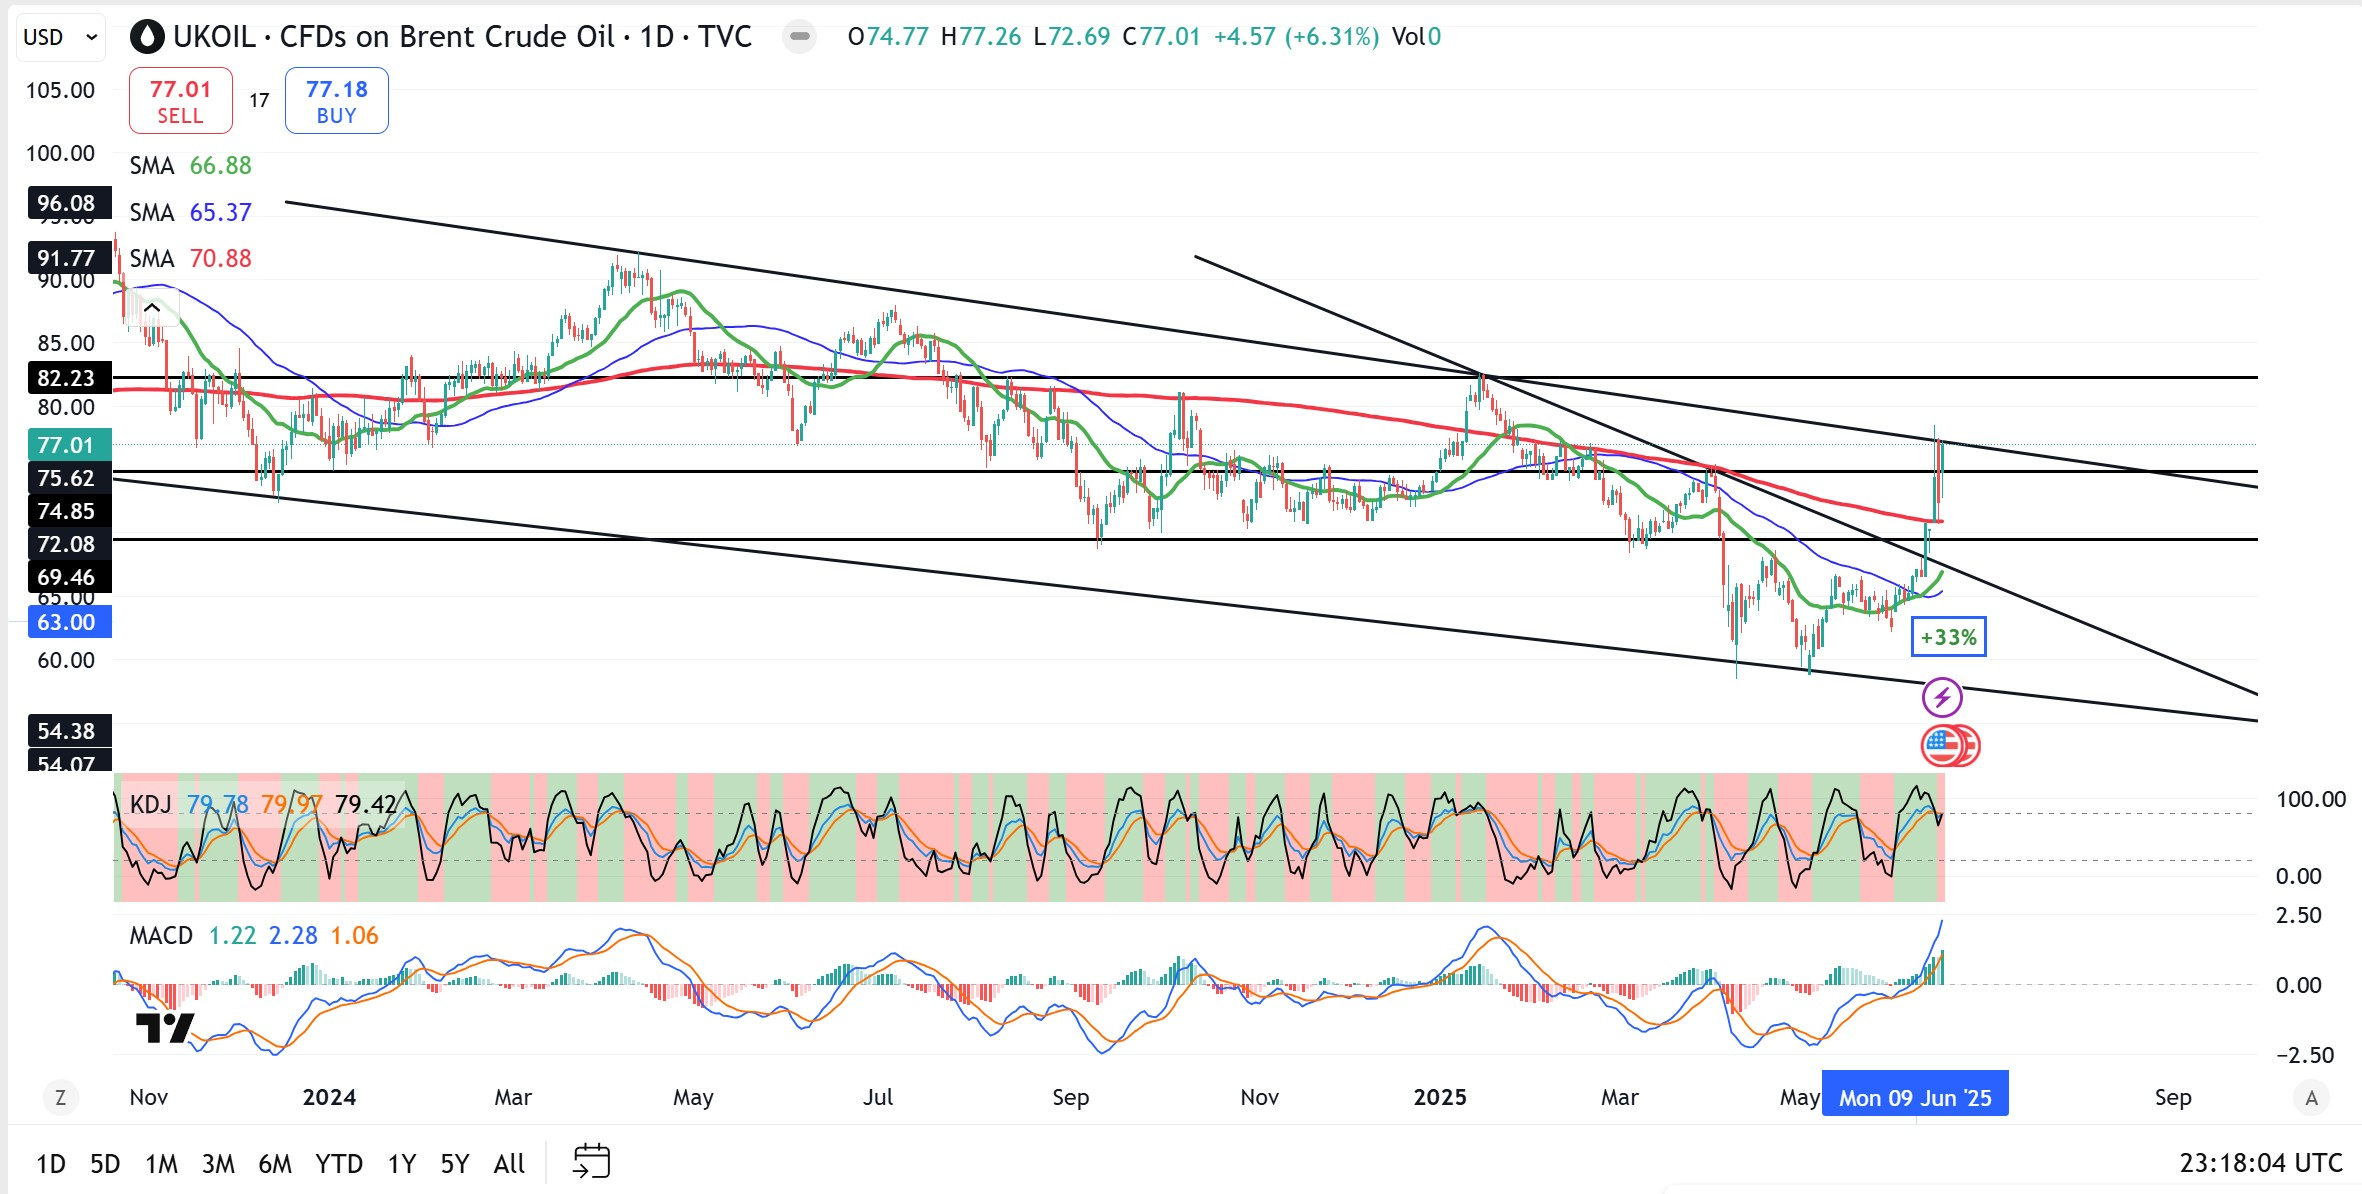
From the technical perspective, Brent crude oil have breached above the key $75–$76 resistance zone, hitting $77.01 and piercing through the upper bound of a long-term descending channel. The breakout follows a 33% surge from the May lows and a sharp 10% gain since last Friday.
KDJ readings near overbought territory suggest short-term momentum may be stretched, though MACD continues to accelerate higher, reinforcing bullish sentiment.
Immediate resistance lies at $82.23 (January peak), while $75.12 now act as imminent support. A successful hold above the breakout zone confirms a trend reversal with potential to return to test last July peak around $87.
Gold
Gold surged past $3,386 an ounce on Tuesday, extending its rebound as intensifying Middle East tensions drove a fresh wave of safe-haven demand. Meanwhile, U.S. economic data added to the risk-off tone. May retail sales fell 0.9%, and industrial production dipped 0.2%, both undershooting expectations, adding to the bet for an early rate cut.
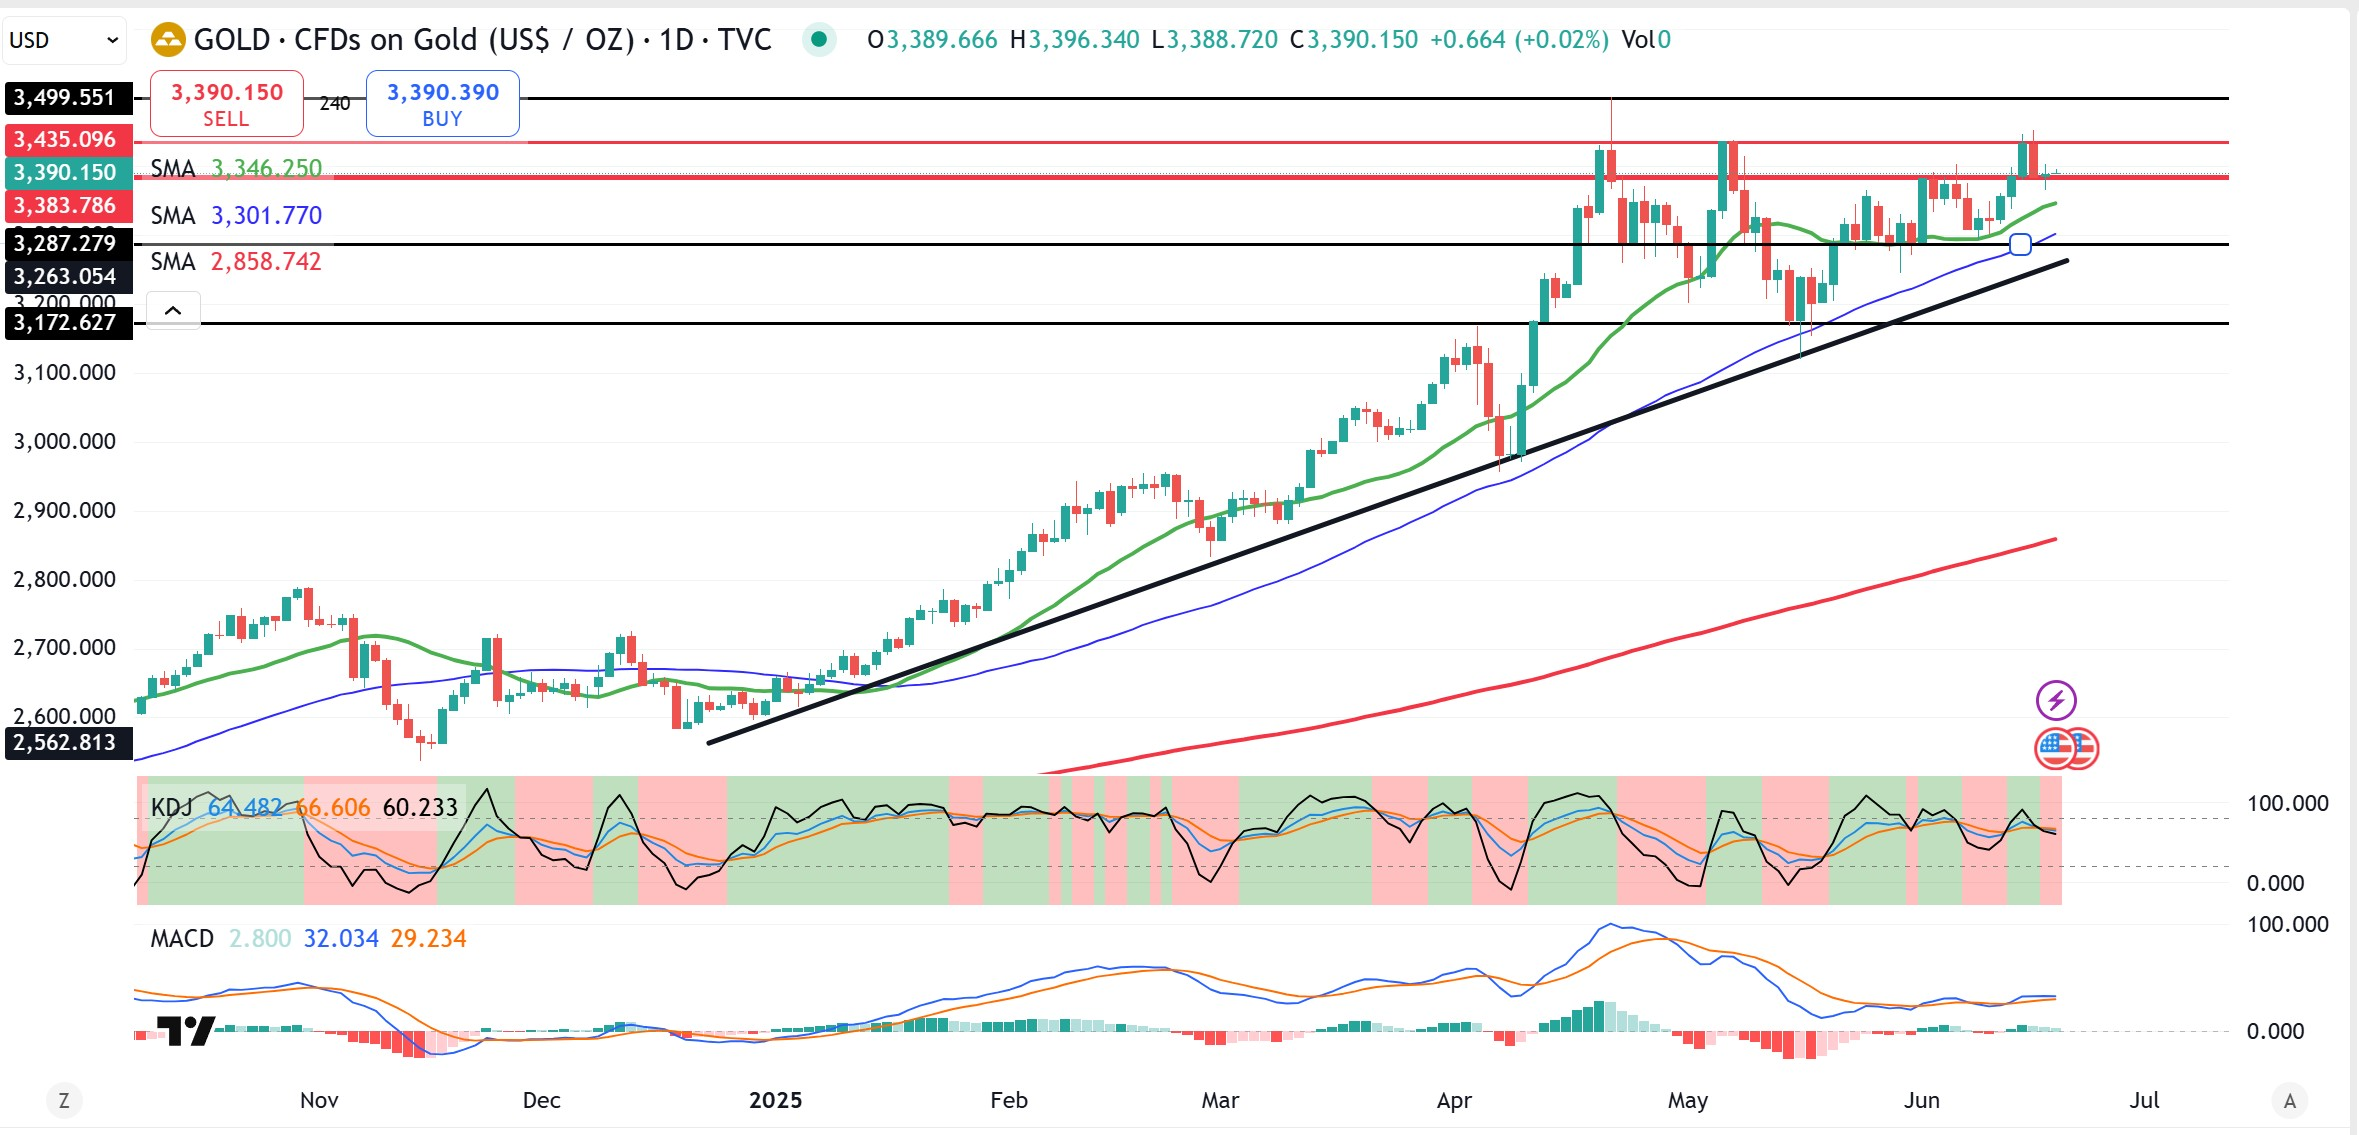
According to the daily chart, gold’s uptrend remains intact with price action supported by a rising trendline and the 20-day SMA ($3,346). Immediate resistance sits at $3,435, with a decisive breakout paving the way toward the $3,500 psychological zone.
On the downside, watch $3,280 as initial support. KDJ signals are flattening, suggesting consolidation, while MACD remains in positive territory with a potential bullish crossover.
Disclaimer: The material provided here has not been prepared in accordance with legal requirements designed to promote the independence of investment research and as such is considered to be a marketing communication. Whilst it is not subject to any prohibition on dealing ahead of the dissemination of investment research we will not seek to take any advantage before providing it to our client. No representation or warranty is given as to the accuracy or completeness of this information and therefore it shouldn’t be relied upon as such. Any research provided does not have regard to specific financial situations, needs or investment objectives. Vantage accepts no responsibility for any use that may be made of these comments and for any consequences that result. Consequently, any person acting on it does so entirely at their own risk. We advise any readers of this material to seek professional advice where necessary. Without the approval of Vantage, reproduction or redistribution of this information isn’t permitted.
-

Open Trading Account
Discover the endless trading possibilities with our cutting-edge platform, designed to empower our traders. Practice trading the markets with a free demo account today.
-

Download Vantage App
Trade on the go with the Vantage All-In-One Trading App, where smooth execution and market access come together in the palm of your hand.
-

Start Trading
Are you an existing user? Login to your account to start trading 1,000+ CFD products including forex, indices, gold, shares and more.
