
 Register
 Login
 Register





Is Silver Following the Same Playbook as 2011?

Ludmila Insaurralde >
Market Analyst
Ludmila Insaurralde >
Market Analyst
 Updated Mon, 2026 August 3 09:33

The current silver market is showing a technical structure that closely resembles one of the most dramatic cycles in modern history.
That is why many technical analysts are drawing comparisons between today’s silver market and the 2010–2011 rally. Although separated by more than a decade, both periods share a strikingly similar sequence of price movements, from a powerful breakout and blow-off top to a sharp correction and retracement back towards a key technical zone.
Whether the current cycle ultimately follows the same path remains uncertain. However, the similarities are compelling enough to make this one of the most closely watched charts in the precious metals market today.
The 2011 Silver Cycle
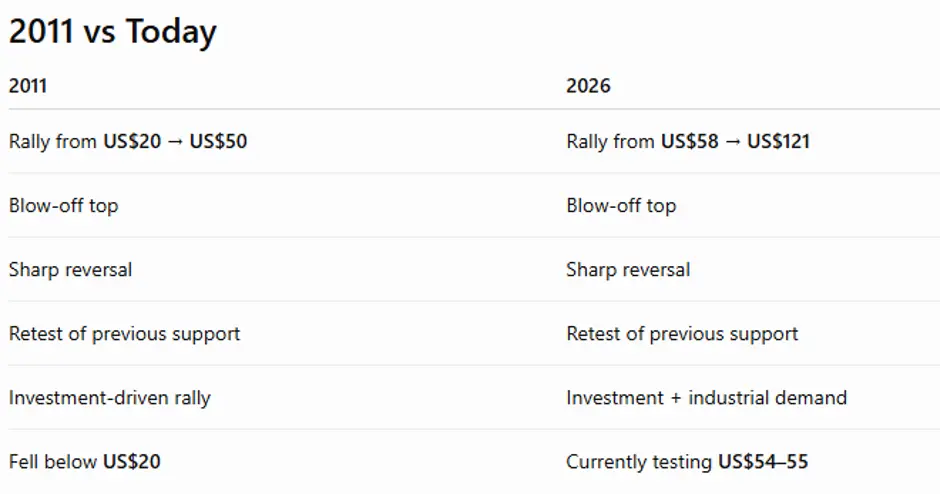
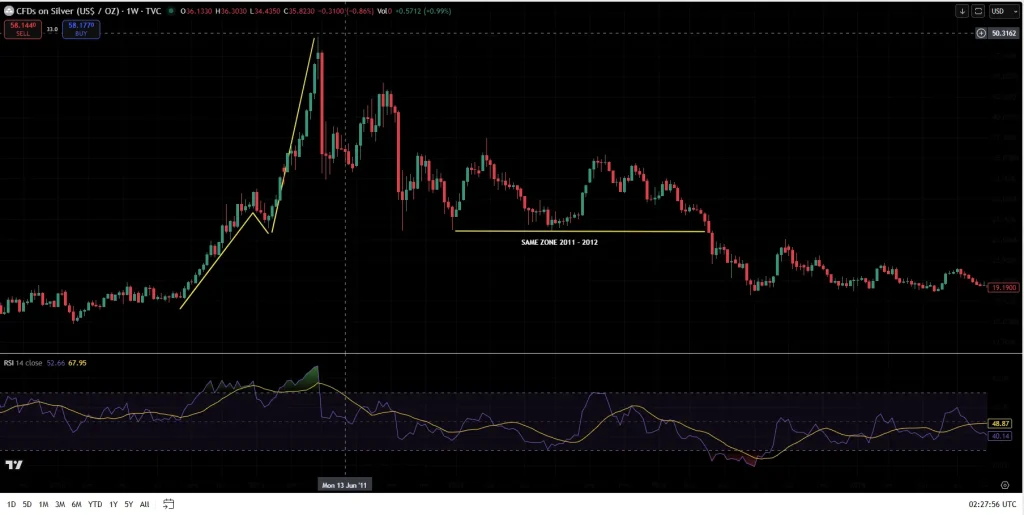
Following the Global Financial Crisis, silver rallied from around US$20 to almost US$50 in less than a year, becoming one of the strongest precious metals rallies of the modern era.
The trigger wasn’t sentiment, it was leverage. The COMEX exchange hiked margin requirements five times in nine days, forcing over-leveraged traders to sell, and silver lost 30% in under two weeks.
The move proved unsustainable. Within twelve months, silver had fallen back below US$20, highlighting how quickly momentum-driven markets can reverse once sentiment changes.
Why Are Traders Comparing It With Today?
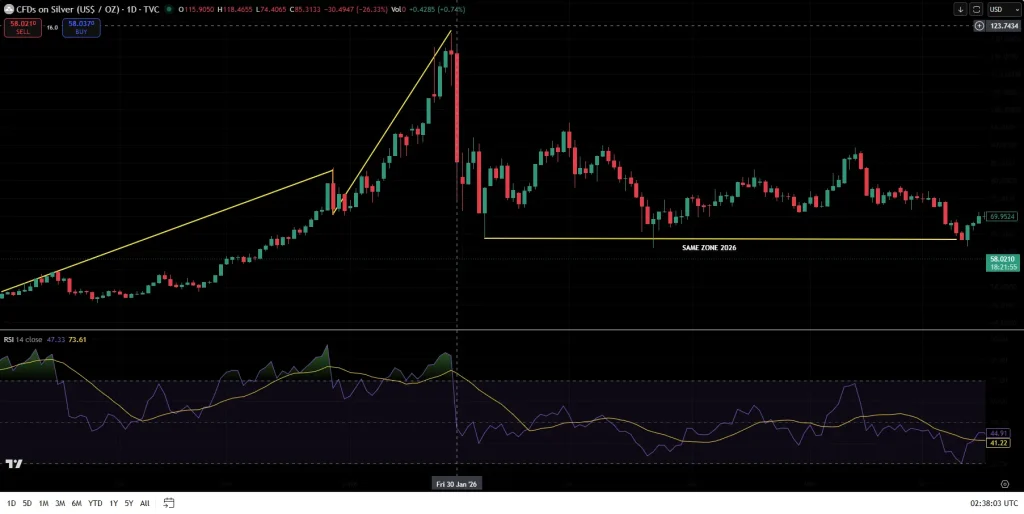
Looking at the two charts side by side, three things stand out. Both rallies finally broke a ceiling that had held for decades, silver failed to clear US$50 in 2011, then broke through it decisively this cycle. Both topped in a violent, near-instant reversal rather than a slow rollover. And both corrections cut the price by roughly half from the peak, not a shallow pullback, but a genuine unwind. After rallying to record highs earlier this year, silver corrected more than 50%, from around US$121 to approximately US$58, landing back at a major long-term support zone, the same kind of level that capped the 2011 decline.
Similar Structure, Different Fundamentals
Although the charts look remarkably similar, the underlying drivers are very different.
Unlike 2011, when investment demand dominated, today’s silver market is supported by significantly stronger industrial demand from sectors including solar energy, electrification and artificial intelligence infrastructure. Similar price action, however, does not guarantee the same outcome.
| Segment | Volume (Moz) | Share |
| Industrial | 657.4 | 58% |
| Jewellery & Silverware | ~195 | 17% |
| Coin & Bar (physical investment) | 217.7 | 19% |
| Other/net | ~60 | 5% |
Industrial demand alone now exceeds the entire global silver supply from mining, the market has run a deficit for five straight years, with 762 million ounces drawn from above-ground stockpiles since 2021.
Technical Analysis: Silver has now returned to an important technical zone
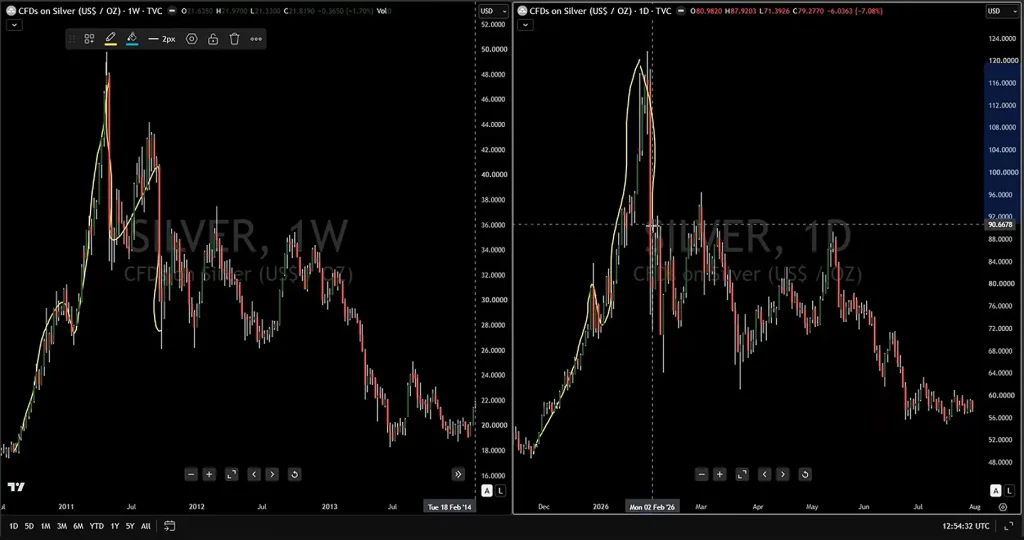
Silver is currently trading around US$58.25, sitting just above an important long-term support zone between US$54 and US$55.
If buyers defend this region, attention is likely to shift towards US$70, which has now become the first major resistance. A move above US$94.80 would suggest the broader technical picture is beginning to improve.
How silver responds around these levels may determine whether buyers begin rebuilding momentum or whether the correction continues.
FINAL THOUGHTS
The current silver market is not a copy of 2011. The economic backdrop has changed, industrial demand is stronger and the drivers behind the rally are very different.
Yet the similarities in price structure are difficult to ignore.
Whether the current cycle ultimately follows the path of 2011 remains uncertain. What makes today’s market so compelling is not the prediction itself, but the fact that, more than a decade later, the chart is once again displaying a remarkably familiar structure. For technical traders, that alone makes silver one of the most interesting markets to watch in the months ahead
Disclaimer: The material provided here has not been prepared in accordance with legal requirements designed to promote the independence of investment research and as such is considered to be a marketing communication. Whilst it is not subject to any prohibition on dealing ahead of the dissemination of investment research we will not seek to take any advantage before providing it to our client. No representation or warranty is given as to the accuracy or completeness of this information and therefore it shouldn’t be relied upon as such. Any research provided does not have regard to specific financial situations, needs or investment objectives. Vantage accepts no responsibility for any use that may be made of these comments and for any consequences that result. Consequently, any person acting on it does so entirely at their own risk. We advise any readers of this material to seek professional advice where necessary. Without the approval of Vantage, reproduction or redistribution of this information isn’t permitted.
-

Open Trading Account
Discover the endless trading possibilities with our cutting-edge platform, designed to empower our traders. Practice trading the markets with a free demo account today.
-

Download Vantage App
Trade on the go with the Vantage All-In-One Trading App, where smooth execution and market access come together in the palm of your hand.
-

Start Trading
Are you an existing user? Login to your account to start trading 1,000+ CFD products including forex, indices, gold, shares and more.
