
 Register
 Login
 Register





CBA’s Earnings: Australia’s Most Expensive Bank Faces Its Biggest Test Yet

Ludmila Insaurralde >
Market Analyst
Ludmila Insaurralde >
Market Analyst
 Updated Fri, 2026 August 7 06:38

Preview: Commonwealth Bank will report its full-year earnings on Wednesday, 12 August. As Australia’s highest-valued major bank by forward P/E, CBA heads into one of its most closely watched earnings reports in years. After soaring to record highs before suffering one of its sharpest single-day falls in May, investors now want to know whether that premium valuation is still justified.
CBA currently trades at the richest forward P/E multiple among Australia’s major banks, meaning investors are paying more for each dollar of expected earnings than they are for NAB, Westpac, ANZ or Bendigo Bank.
To understand why this earnings report matters more than most, look at what CBA’s share price has already done twice this year. In February, CBA reported a record first-half cash profit of $5.445 billion, up 6% from a year earlier. The result was supported by improving credit quality and a higher dividend, sending the share price up 6.8% on the day before adding another 5.4% in the following session.
Then came May. CBA’s Q3 trading update showed profit growth slowing and, more importantly, a $200 million top-up to provisions “reflecting heightened geopolitical and macroeconomic uncertainty” banking -speak for we’re bracing for something. The stock didn’t just dip. It crashed 10.43% in a single session, one of CBA’s worst days in years.
Same bank, same year, two completely opposite market reactions. Wednesday’s full-year result is the tiebreaker.
What the market actually needs answered
Strip away the noise, and there are three things worth watching:
- Was that $200 million provision top-up a one-off, or the start of a trend? Analysts expect full-year cash profit around $10.85 billion, up from $10.25 billion solid growth, but the real story is in the impairment line, not the headline number.
- Is the margin holding? Net interest margin came in at 2.04% in H1, down 4 basis points. Competition among the majors hasn’t eased.
- The dividend. Consensus sits at roughly $5.05 for the full year, up from $4.85, a concrete, readable number that will move sentiment almost as much as the profit line itself.
There’s also a sector-wide read-through worth flagging: NAB recently reported a 15% drop in home loan applications and a rise in “watch loans”, an early warning sign CBA, as the country’s largest investor-loan lender, can’t fully escape, especially with federal Budget changes curbing negative gearing and the capital gains tax discount on the horizon.
The AI bet behind the price tag
If CBA is going to justify a 25x multiple, this is its argument for why: over the past few months, the bank has appointed a new Group CIO (Victoria Ledda, ex-Goldman Sachs) and Group CTO (Rodrigo Castillo, ex-HSBC), hired what it describes as the first Chief AI Scientist inside an Australian bank, and hosted OpenAI’s Sam Altman for an internal summit. Technology and AI investment spend rose 10% to $1.2 billion in H1 alone. CEO Matt Comyn’s pitch is straightforward: AI-driven efficiency is how CBA defends its margin and its multiple at the same time. Wednesday is the first time investors get to see whether that spending is actually showing up in the numbers, or just in the headlines.
Technical Analysis: CBA at the Crossroads: $184 Is the Line Between $200 and $154
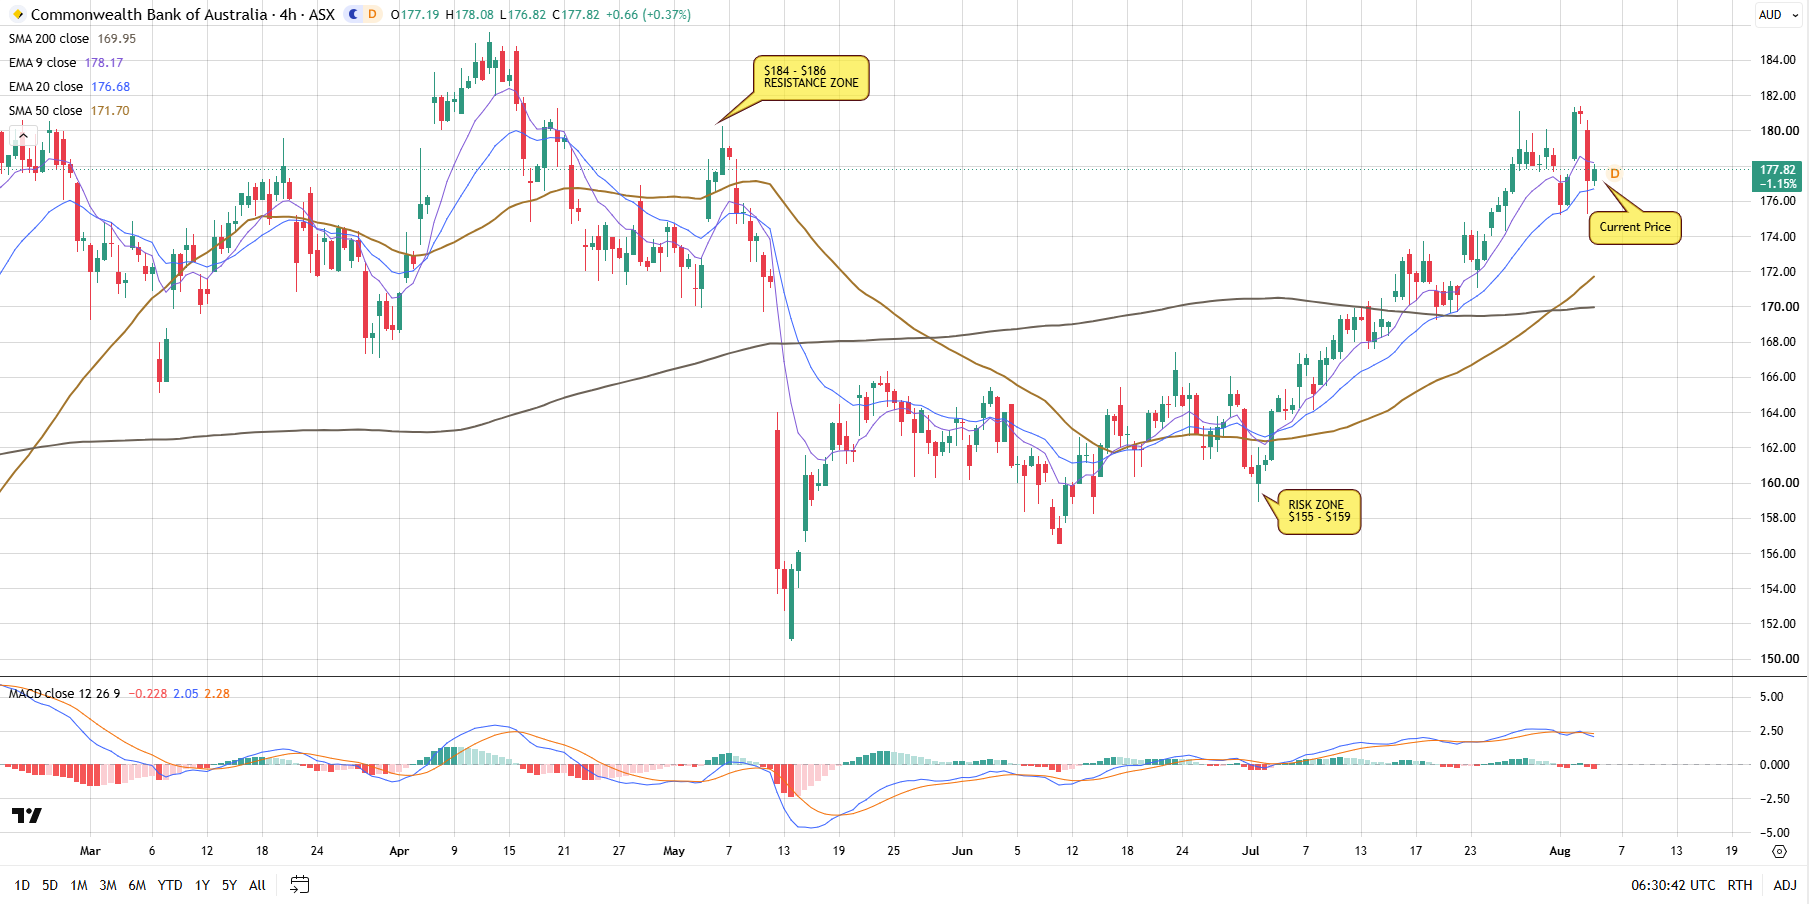
CBA is trading around $177.82, still consolidating after a standout 120% rally from its 2023 low of $86.98 to a peak of $192.00 in late 2025. The $184-$186 region marks the highs reached after May’s sell-off and has rejected every recovery attempt since then, making it the key resistance level separating the current consolidation from a potential return to record highs.
A sustained break above it would signal the correction is over, confirming January’s $146.98 low as the cycle bottom and reopening the path to $192, then $200. Stay below it, and a retest of $154 remains on the table.
Wednesday’s earnings report is the likely catalyst either way, a clean beat could finally clear resistance, while a repeat of May’s provisioning shock could send CBA back toward $154.
Key numbers to watch
Cash Profit
Consensus: ~A$10.85bn
Dividend
Consensus: ~A$5.05 per share
Net Interest Margin
Previous: 2.04%
Loan Impairments
Watch for any increase in provisioning after May’s A$200m top-up.
The bottom line
Whether CBA beats expectations or disappoints, this report is likely to shape sentiment across the entire Australian banking sector. With the stock still trading at the richest valuation among its peers, investors won’t just be looking at the headline profit, they’ll be deciding whether that premium remains justified.
Disclaimer: The material provided here has not been prepared in accordance with legal requirements designed to promote the independence of investment research and as such is considered to be a marketing communication. Whilst it is not subject to any prohibition on dealing ahead of the dissemination of investment research we will not seek to take any advantage before providing it to our client. No representation or warranty is given as to the accuracy or completeness of this information and therefore it shouldn’t be relied upon as such. Any research provided does not have regard to specific financial situations, needs or investment objectives. Vantage accepts no responsibility for any use that may be made of these comments and for any consequences that result. Consequently, any person acting on it does so entirely at their own risk. We advise any readers of this material to seek professional advice where necessary. Without the approval of Vantage, reproduction or redistribution of this information isn’t permitted.
-

Open Trading Account
Discover the endless trading possibilities with our cutting-edge platform, designed to empower our traders. Practice trading the markets with a free demo account today.
-

Download Vantage App
Trade on the go with the Vantage All-In-One Trading App, where smooth execution and market access come together in the palm of your hand.
-

Start Trading
Are you an existing user? Login to your account to start trading 1,000+ CFD products including forex, indices, gold, shares and more.
