
 Register
 Login
 Register





Australian inflation cools to 4% while the Aussie dollar breaks below US70¢

Hebe Chen >
Senior Market Analyst
Hebe Chen >
Senior Market Analyst
 Updated Thu, 2026 June 25 03:10

Australian shares slightly extended gains on Wednesday after a mixed inflation print showed headline inflation cooling more than expected, while the RBA’s preferred trimmed mean measure came in hotter than forecast.
Headline CPI rose 4.0% year-on-year in May, below market expectations of 4.3% and down from 4.2% in April. On a monthly basis, headline CPI fell 0.7%, compared with expectations for a 0.4% decline. However, the trimmed mean measure rose 0.4% month-on-month, above forecasts for 0.3%. That kept sentiment capped, as underlying inflation remains above the RBA’s target.
The Australian dollar was flat at US69.20¢ after sliding sharply overnight from above US70¢, as markets priced in rising odds of another US interest rate hike. Attention now turns to Thursday’s Australian Labour Force data, followed by key US inflation figures later this week.
Wall Street struggled overnight as technology stocks led another broad sell-off. The S&P 500 fell 1.4%, while the Nasdaq 100 dropped 3.3% after heavyweight semiconductor stocks came under renewed pressure. Investors continued questioning whether the enormous capital spending on AI infrastructure can generate sufficient long-term returns, prompting another round of profit-taking across the sector.
Elsewhere, the US 10-year Treasury yield eased to 4.48% as improving prospects for a US-Iran peace agreement supported demand for government bonds. Oil prices also extended their decline, with WTI crude falling below US$73 a barrel as more tankers resumed transit through the Strait of Hormuz, easing concerns over global supply disruptions.
This week’s technical focus turns to three major themes: whether EUR/USD’s correction is gathering pace under a stronger US dollar, whether gold can defend its key long-term support, and whether the Nasdaq’s AI-driven rally is entering a deeper consolidation phase.
EUR/USD — Stronger Dollar Keeps Euro Under Pressure
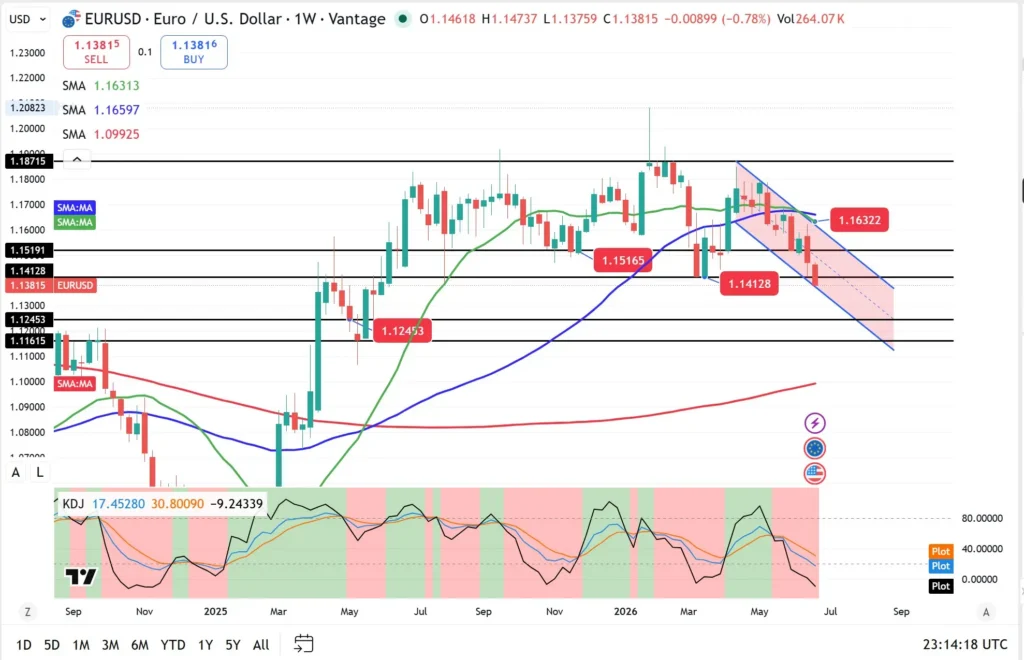
EUR/USD continues to trend lower as renewed US dollar strength gathers momentum, driven by firmer inflation expectations and resilient US interest rate pricing. The pair has broken below several key support levels and remains trapped within a well-defined descending channel.
Technically, the price remains below both the 20-day and 50-day moving averages, while momentum indicators remain firmly negative. The failure to reclaim resistance around 1.1515 confirms that sellers remain in control, with the broader correction continuing to unfold.
Immediate support now sits around 1.1245. A break below this area could expose the next downside objective near 1.1160. On the upside, initial resistance remains around 1.1410, followed by stronger resistance near 1.1630, where the declining trendline and moving averages continue to cap recovery attempts.
For now, the broader trend remains dominated by US dollar strength, as markets continue to favour the greenback amid limited expectations for near-term Federal Reserve rate cuts.
Gold — Key Long-Term Support Under Pressure
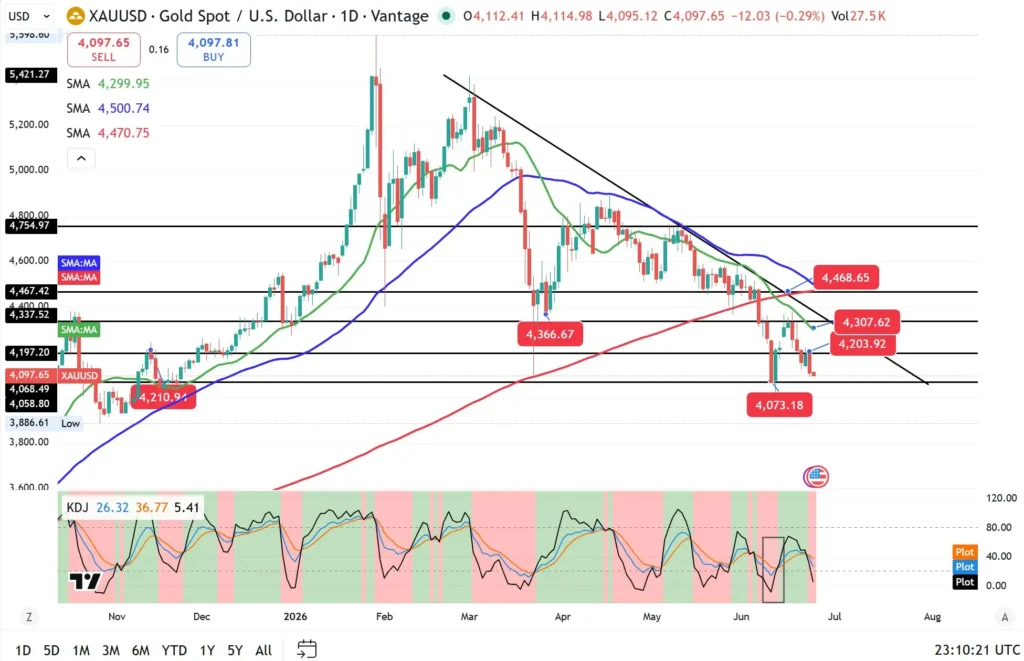
Gold remains under pressure after falling below US$4,203, as rising US dollar strength continues to outweigh the traditional safe-haven appeal of bullion.
While easing Middle East tensions have reduced the demand for defensive assets, the primary driver remains monetary policy. Markets continue to price in a higher-for-longer Federal Reserve, limiting the appeal of non-yielding assets despite softer Treasury yields.
Technically, gold remains below all major moving averages and continues to trade beneath the long-term descending trendline that has capped recoveries since March. Momentum indicators remain weak, suggesting sellers are still dictating the broader trend.
Immediate support is now located around US$4,070, followed by the significant psychological level near US$4,000. On the upside, gold first needs to reclaim US$4,200. Stronger resistance is clustered between US$4,300 and US$4,470, which must be cleared before any broader structural recovery can develop.
Unless gold can regain those upper resistance levels, any near-term bounce is likely to be viewed as a corrective recovery rather than the beginning of a new uptrend.
Nasdaq 100 — AI Optimism Faces Another Reality Check
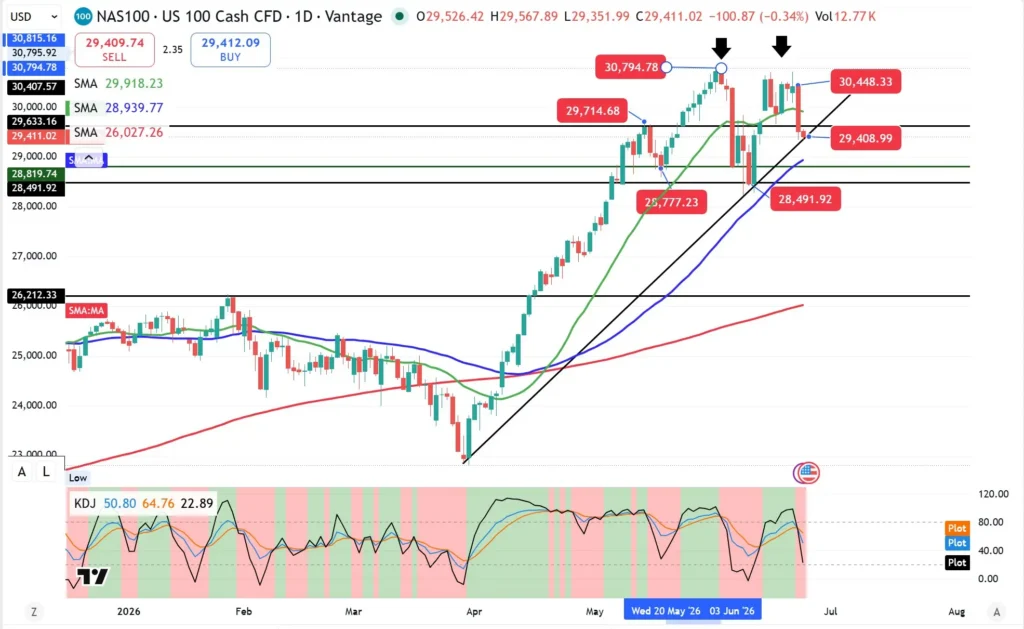
The Nasdaq 100 has entered a deeper pullback following another sharp wave of selling across semiconductor and AI-related shares. Investors are becoming increasingly selective as concerns grow over whether massive AI infrastructure spending will ultimately generate sufficient earnings returns.
Technically, the index has slipped back below 29,714, placing the recent breakout under pressure as momentum indicators continue to roll over from overbought territory. The short-term uptrend has weakened considerably following repeated failures near the 30,800 peak.
Immediate support now sits around 29,400—the trendline since April low, with stronger structural support located near 28,500. On the upside, resistance remains around 29,700, followed by 30,450, where recent selling pressure has repeatedly emerged.
While the longer-term trend remains constructive, the combination of elevated valuations and growing uncertainty around AI earnings is encouraging investors to lock in profits and reduce risk exposure following the exceptionally strong rally earlier this year.
Disclaimer: The material provided here has not been prepared in accordance with legal requirements designed to promote the independence of investment research and as such is considered to be a marketing communication. Whilst it is not subject to any prohibition on dealing ahead of the dissemination of investment research we will not seek to take any advantage before providing it to our client. No representation or warranty is given as to the accuracy or completeness of this information and therefore it shouldn’t be relied upon as such. Any research provided does not have regard to specific financial situations, needs or investment objectives. Vantage accepts no responsibility for any use that may be made of these comments and for any consequences that result. Consequently, any person acting on it does so entirely at their own risk. We advise any readers of this material to seek professional advice where necessary. Without the approval of Vantage, reproduction or redistribution of this information isn’t permitted.
-

Open Trading Account
Discover the endless trading possibilities with our cutting-edge platform, designed to empower our traders. Practice trading the markets with a free demo account today.
-

Download Vantage App
Trade on the go with the Vantage All-In-One Trading App, where smooth execution and market access come together in the palm of your hand.
-

Start Trading
Are you an existing user? Login to your account to start trading 1,000+ CFD products including forex, indices, gold, shares and more.
