
 Register
 Login
 Register





ASX 200 Stumbles Out of the Gate on Monday

Christopher Lewis >
Market Analyst
Christopher Lewis >
Market Analyst
 Updated Tue, 2024 October 1 04:58

- ASX 200 gives up early gains on Monday.
- Overall, many of the major players on the index still in an uptrend.
- Global indices seemingly moving in the same direction.
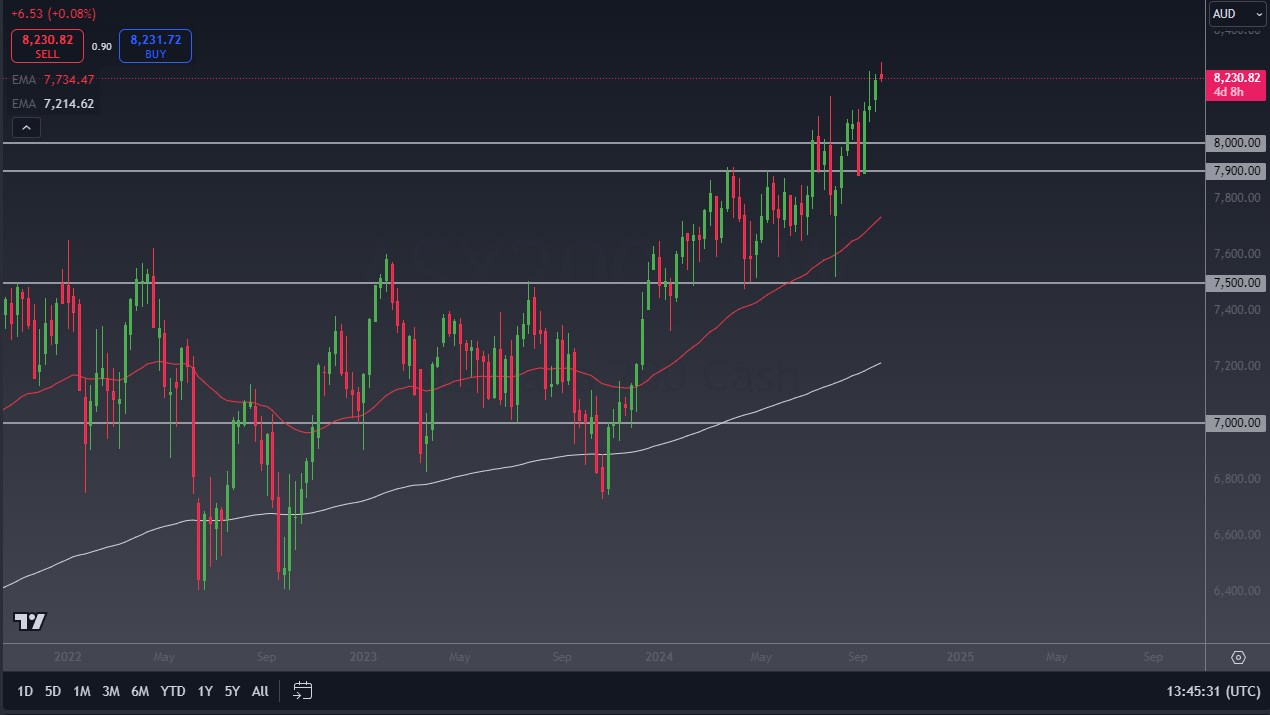
During the early hours of Monday, the ASX 200 initially did try to rally on Monday, only to turn around and show signs of weakness. At this point, the market is likely to continue to see a lot of “buy on the dips behavior”, but at this point it looks like we need to continue to see a lot of hesitation, so I think at this point in time you need to look at the AU$8000 level underneath fast the beginning of a potential “floor in the trend.”
The 50 Day EMA indicator is sitting right around the AU$7700 level and is rising, so that of course is something that technical traders will be watching as well. All things being equal, the market is likely to continue to see a lot of questions asked about what is obviously a very bullish market in general.
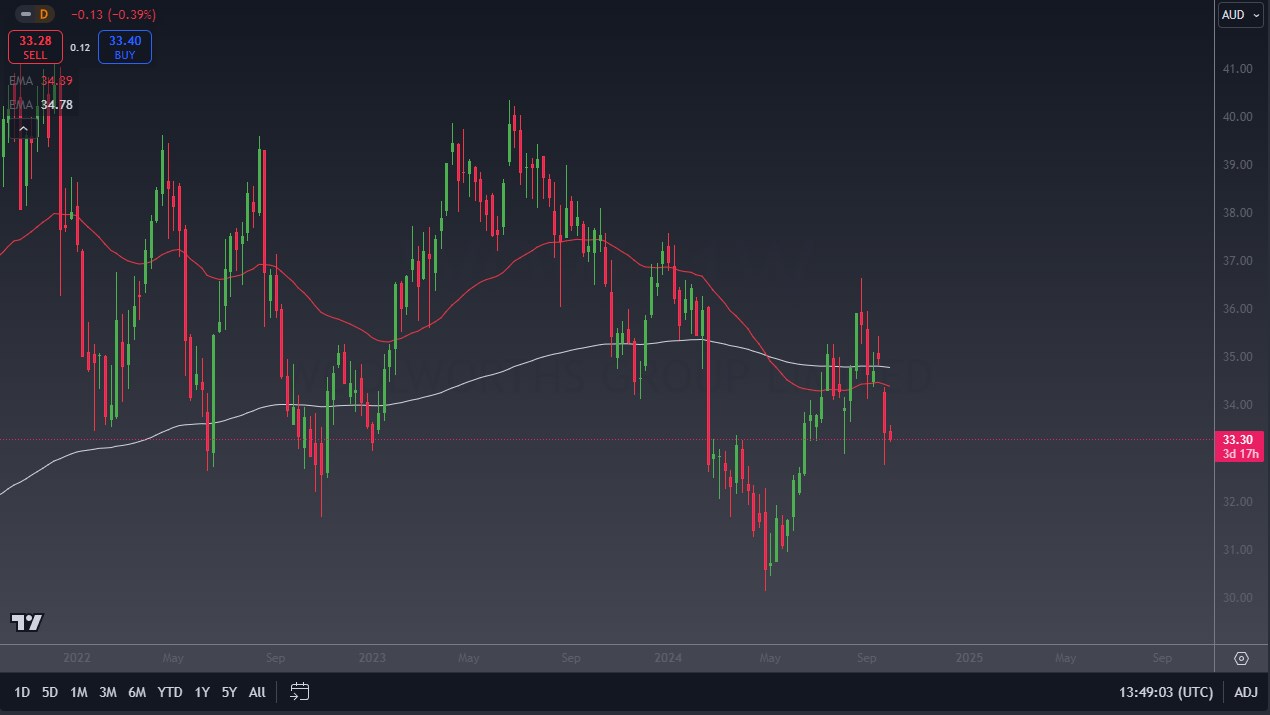
Woolworth’s Group Limited (WOW)
Woolworth’s has dropped a bit during the early hours on Monday, as it looks like the market is continuing to see a certain amount of support near the AU$33 level, but it’s also worth noting that the market recently rallied and might be trying to consolidate some of the gains. However, it’s worth noting that the stock has lost 6.8% over the last month and lost 10.77% over the last year. The consumer staples giant has clearly taken it on the chin as it looks like the overall global economy and employment situation deteriorates.
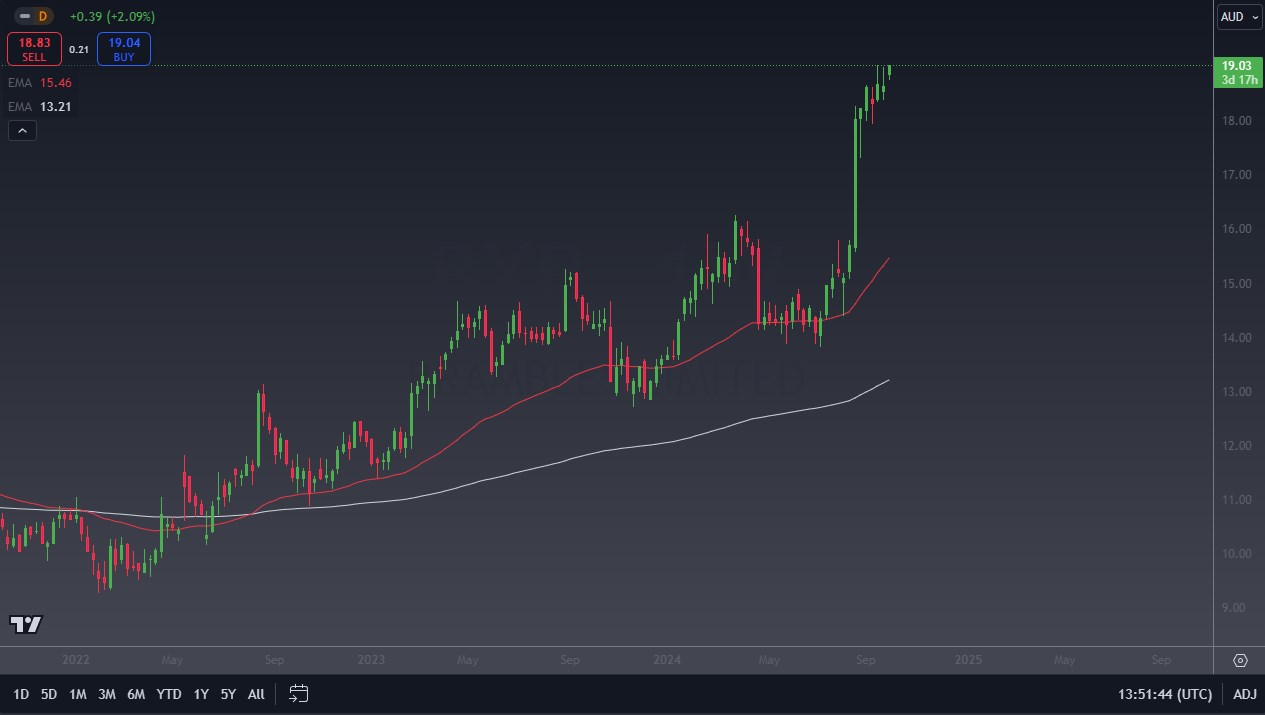
Brambles Ltd (BXB)
Brambles rallied 2.09% during the Monday session, showing signs of strength in what has already been a major mover. Brambles, the industrial powerhouse in Australia, has seen a massive gain over the last year, just shy of 33%. The last 30 days has seen a 6.67% gain, and when you look at the chart, there’s not a lot to see as far as negativity is concerned, as the market is in the process of breaking above the AU$19 level. At this point in time, this looks like a major momentum play, and traders in Australia seem to concur.
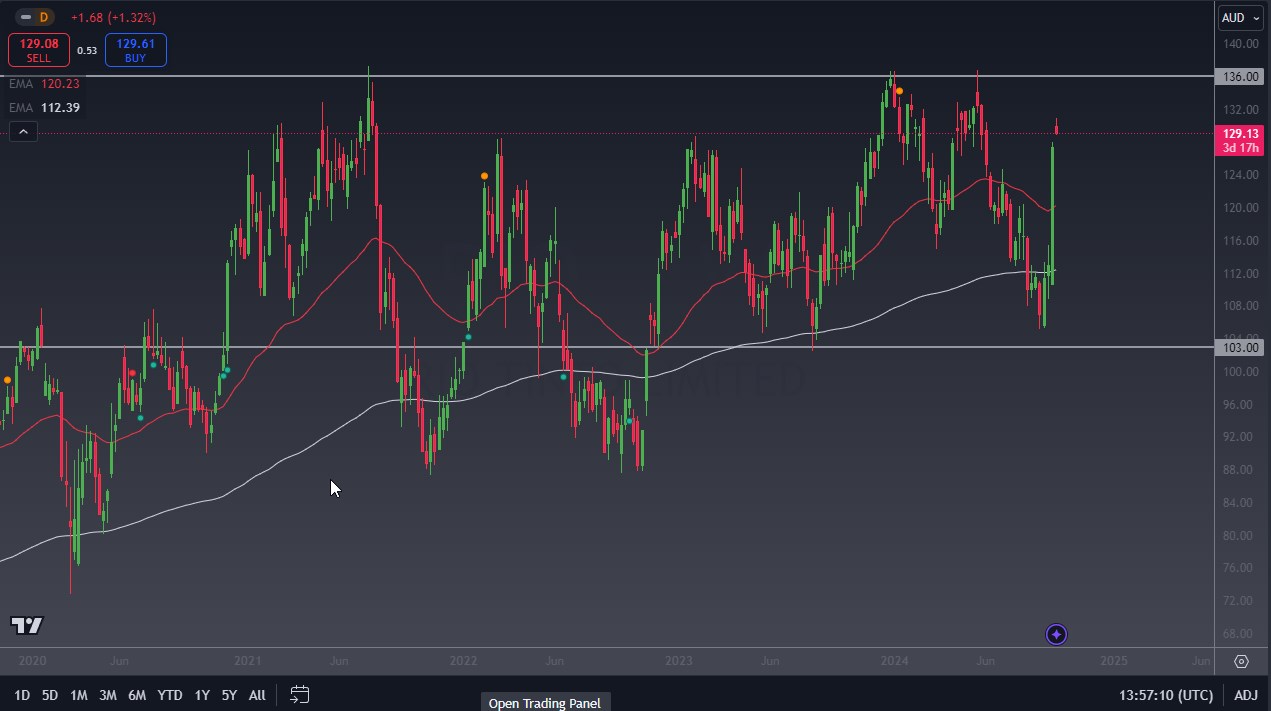
RIO Tinto (RIO)
RIO Tinto rallied 1.32% during the trading session on Monday, which falls in line with the materials giant and its latest move higher. The last month has seen it rally 17.4%, although over the last year we are looking at a gain of 13.72%. All things being equal, the market continues to see a lot of noisy behavior, but I think ultimately, we’ve got a scenario where a lot of traders continue to look at the longer-term consolidation between the AU$103 level and the AU$136 level as being one of the major drivers for technical traders. If the market can break above the AU$136 level, it may kick off the next leg of “FOMO trading”, which seems to be a factor in most indices around the world.
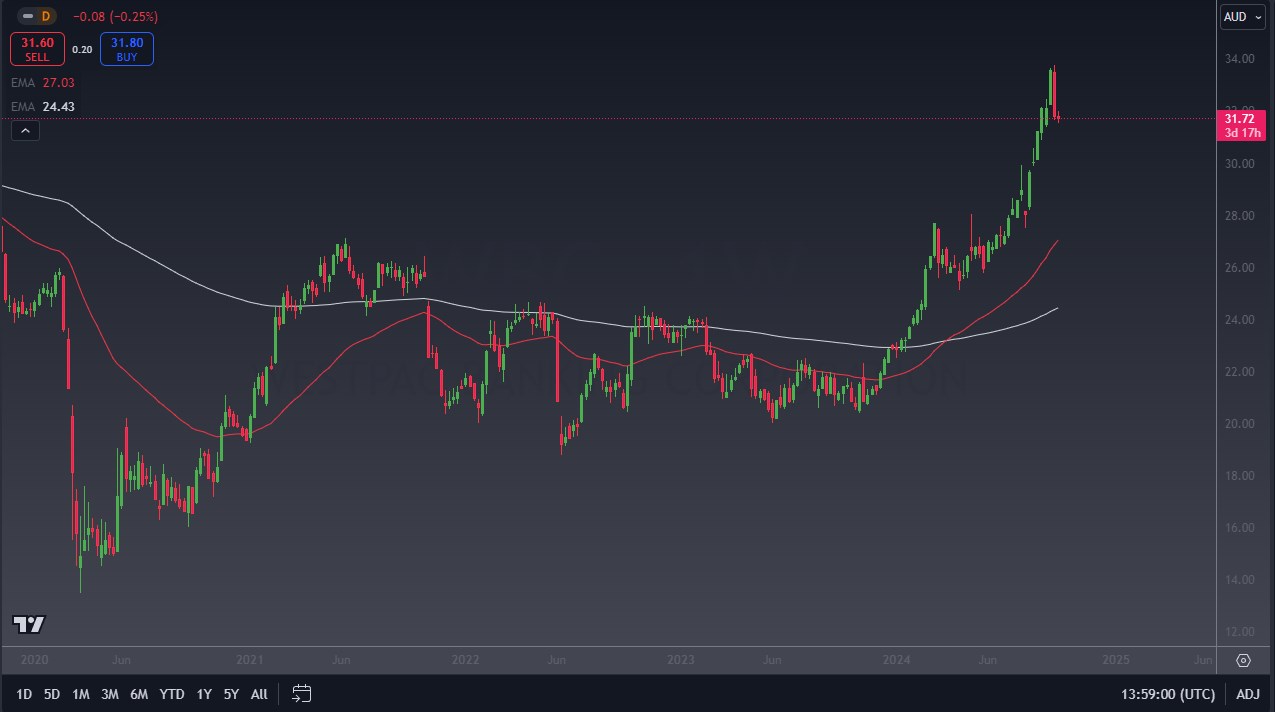
Westpac Banking Corporation (WBC)
Westpac Banking Corporation saw a slight pullback during the trading session on Monday, dropping 25 basis points. The market has been very strong over the last year though, gaining just shy of 50% as the banking giant continues to benefit from interest rates dropping. All things being equal, the pullback that the market had experienced on Monday was more or less something that looked a lot like traders taking advantage of profit, and therefore the trend is still very much intact, and all eyes will more likely than not be on the AU$30 level, as it is the next large, round, psychologically significant figure.
Disclaimer: The material provided here has not been prepared in accordance with legal requirements designed to promote the independence of investment research and as such is considered to be a marketing communication. Whilst it is not subject to any prohibition on dealing ahead of the dissemination of investment research we will not seek to take any advantage before providing it to our client. No representation or warranty is given as to the accuracy or completeness of this information and therefore it shouldn’t be relied upon as such. Any research provided does not have regard to specific financial situations, needs or investment objectives. Vantage accepts no responsibility for any use that may be made of these comments and for any consequences that result. Consequently, any person acting on it does so entirely at their own risk. We advise any readers of this material to seek professional advice where necessary. Without the approval of Vantage, reproduction or redistribution of this information isn’t permitted.
-

Open Trading Account
Discover the endless trading possibilities with our cutting-edge platform, designed to empower our traders. Practice trading the markets with a free demo account today.
-

Download Vantage App
Trade on the go with the Vantage All-In-One Trading App, where smooth execution and market access come together in the palm of your hand.
-

Start Trading
Are you an existing user? Login to your account to start trading 1,000+ CFD products including forex, indices, gold, shares and more.
