
 Register
 Login
 Register





ASX 200 Struggles Along with America

Christopher Lewis >
Market Analyst
Christopher Lewis >
Market Analyst
 Updated Thu, 2025 March 6 07:52

- ASX 200 is facing resistance at the 200-day EMA.
- Global stock indices remain struggling for ex-Europe.
- Australia remains particularly vulnerable to the trade war due to tariffs on Chinese goods.
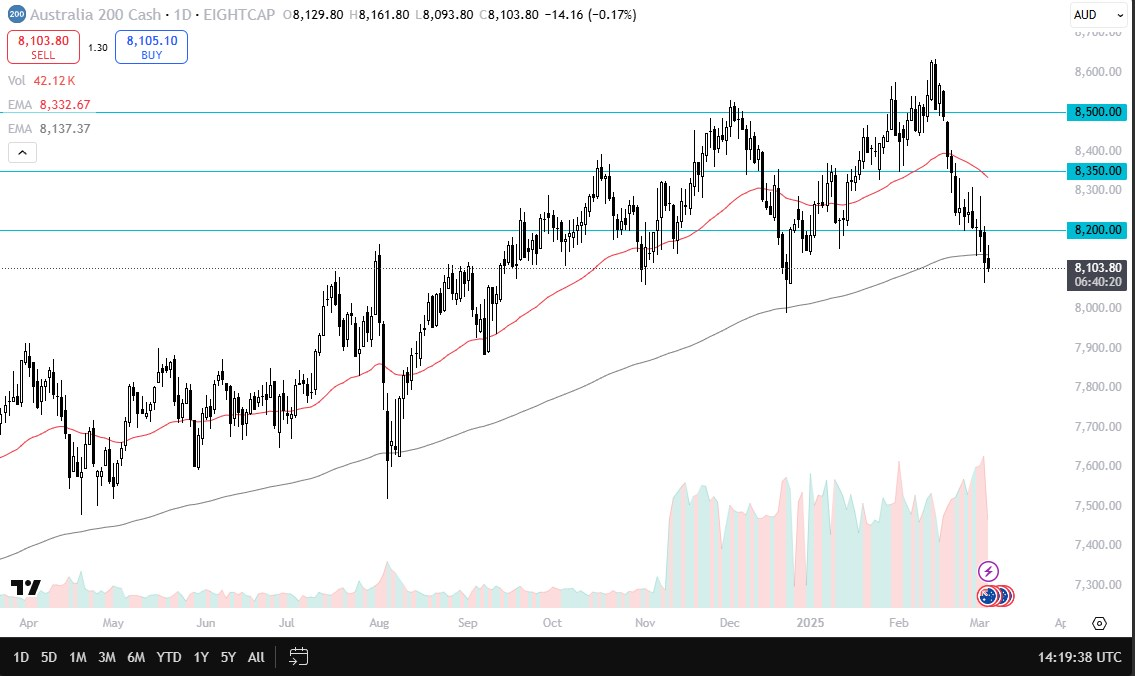
During Wednesday’s trading session, the ASX 200 attempted to push higher but encountered resistance at the 200-Day EMA, suggesting continued downside pressure in the Australian market. The index remains near the 8,100 level, with sentiment appearing increasingly bearish.
Unfortunately, broader economic concerns persist, particularly with recessionary headwinds in the United States, which are likely to impact Australia. Additionally, ongoing trade tensions between the US and China present further risks. Given that China exports a significant volume of goods to the US and Australia relies heavily on exports to China, the indirect economic impact could be substantial. In this environment, heightened volatility is to be expected.
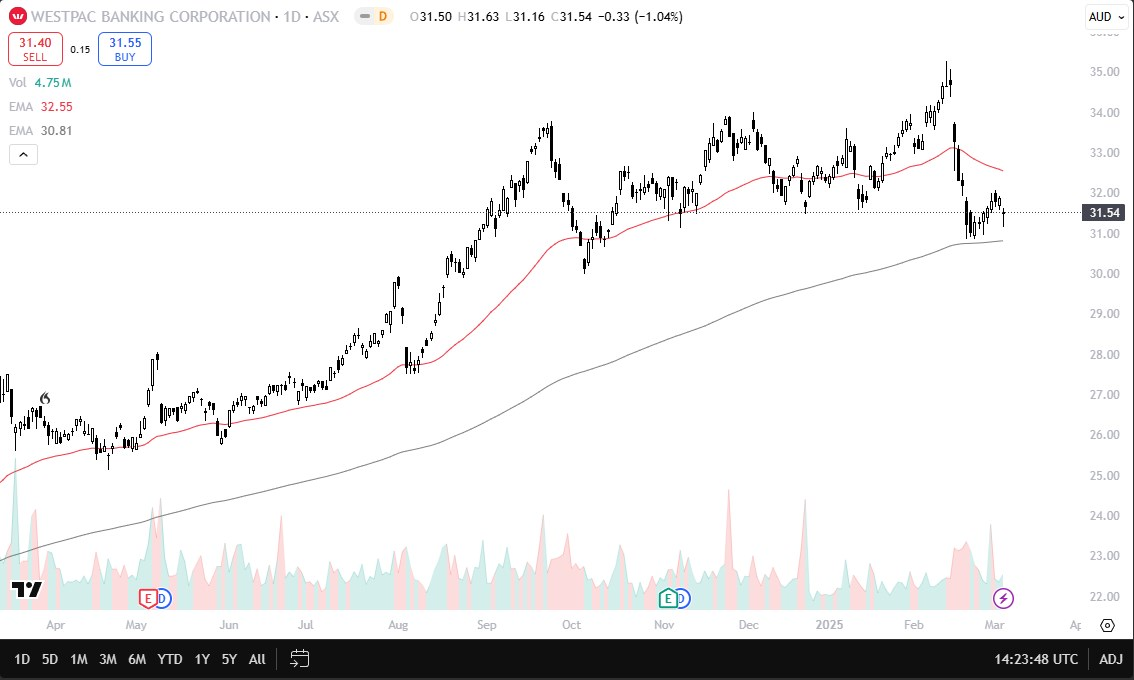
Westpac Banking Corporation (WBC)
Westpac Banking Corporation experienced a negative trading session on Wednesday, however, at this point, it’s worth noting that the session’s candlestick formed a hammer, a traditionally bullish technical signal. Additionally, the stock remains positioned just above the critical 200-Day EMA, which aligns with the AU$31 level. As long as Westpac maintains support above this threshold, there is a strong technical case for the uptrend to remain intact. That said, market conditions remain highly volatile and fluctuations are likely to persist in the near term.
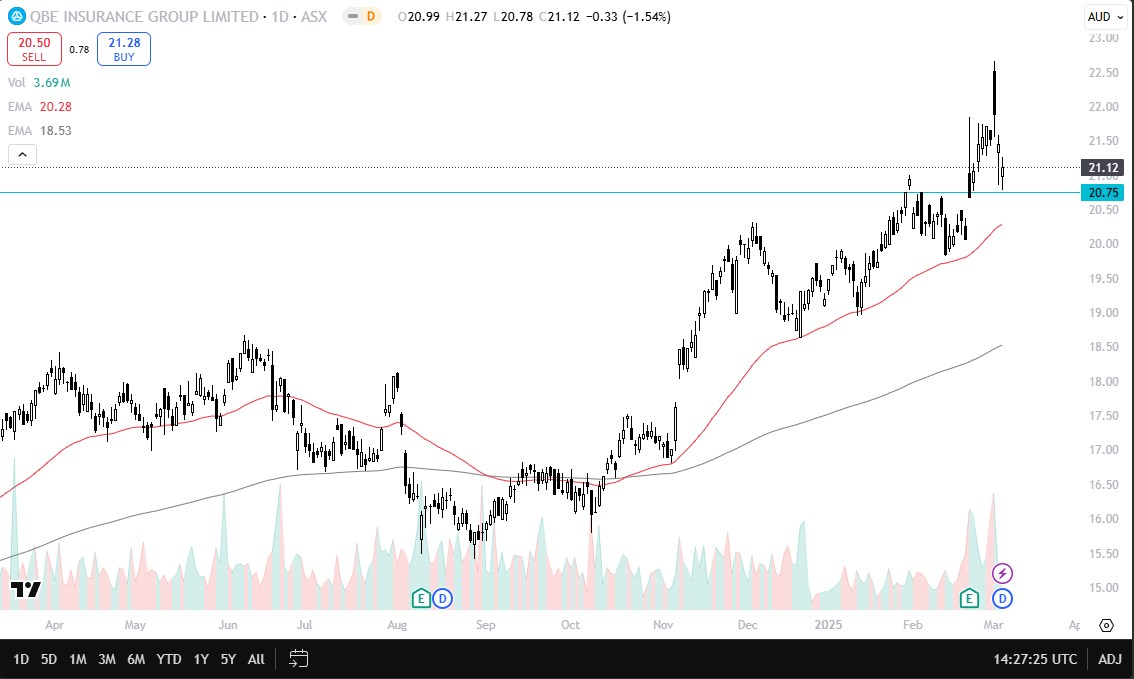
QBE Insurance Group (QBE)
QBE Insurance Group rebounded after initially gapping lower during the trading session on Wednesday. Notably, the stock found support at the AU$20.75 level, a key psychological and technical area, as it previously served as a swing high. The 50-Day EMA is approaching current price levels, reinforcing potential support. Given the recent earnings report surpassing expectations, value-oriented investors may see short-term pullbacks as buying opportunities, reinforcing a “buy on the dips” strategy.
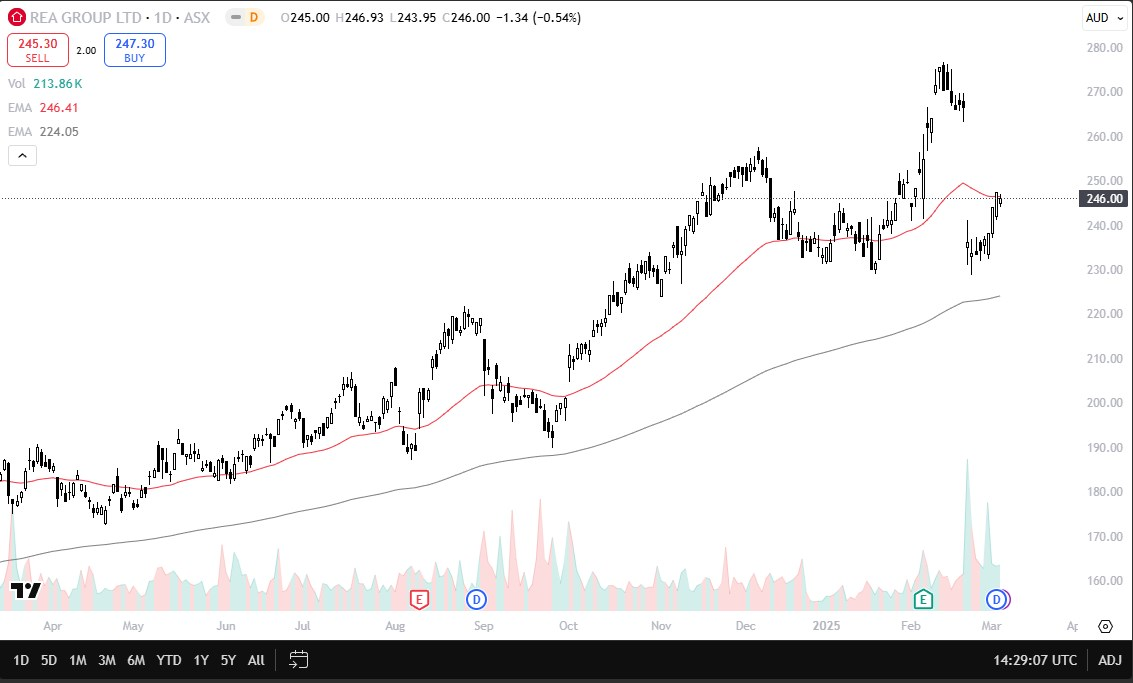
REA Group Limited (REA)
REA Group had a slightly negative session on Wednesday, reflecting broader market struggles in Australia. Despite a stronger-than-expected earnings report, the stock declined by just over 0.5% extending its 30-day loss to 0.90%. Over the past year, REA Group has gained 33.28%, yet a recent sharp gap to the downside has introduced a degree of caution among traders. Given this backdrop, continued volatility appears likely, with the stock expected to move in tandem with broader market trends.
Disclaimer: The material provided here has not been prepared in accordance with legal requirements designed to promote the independence of investment research and as such is considered to be a marketing communication. Whilst it is not subject to any prohibition on dealing ahead of the dissemination of investment research we will not seek to take any advantage before providing it to our client. No representation or warranty is given as to the accuracy or completeness of this information and therefore it shouldn’t be relied upon as such. Any research provided does not have regard to specific financial situations, needs or investment objectives. Vantage accepts no responsibility for any use that may be made of these comments and for any consequences that result. Consequently, any person acting on it does so entirely at their own risk. We advise any readers of this material to seek professional advice where necessary. Without the approval of Vantage, reproduction or redistribution of this information isn’t permitted.
-

Open Trading Account
Discover the endless trading possibilities with our cutting-edge platform, designed to empower our traders. Practice trading the markets with a free demo account today.
-

Download Vantage App
Trade on the go with the Vantage All-In-One Trading App, where smooth execution and market access come together in the palm of your hand.
-

Start Trading
Are you an existing user? Login to your account to start trading 1,000+ CFD products including forex, indices, gold, shares and more.
