
 Register
 Login
 Register





ASX 200 Sits at Major Technical Level

Christopher Lewis >
Market Analyst
Christopher Lewis >
Market Analyst
 Updated Tue, 2024 November 5 03:57

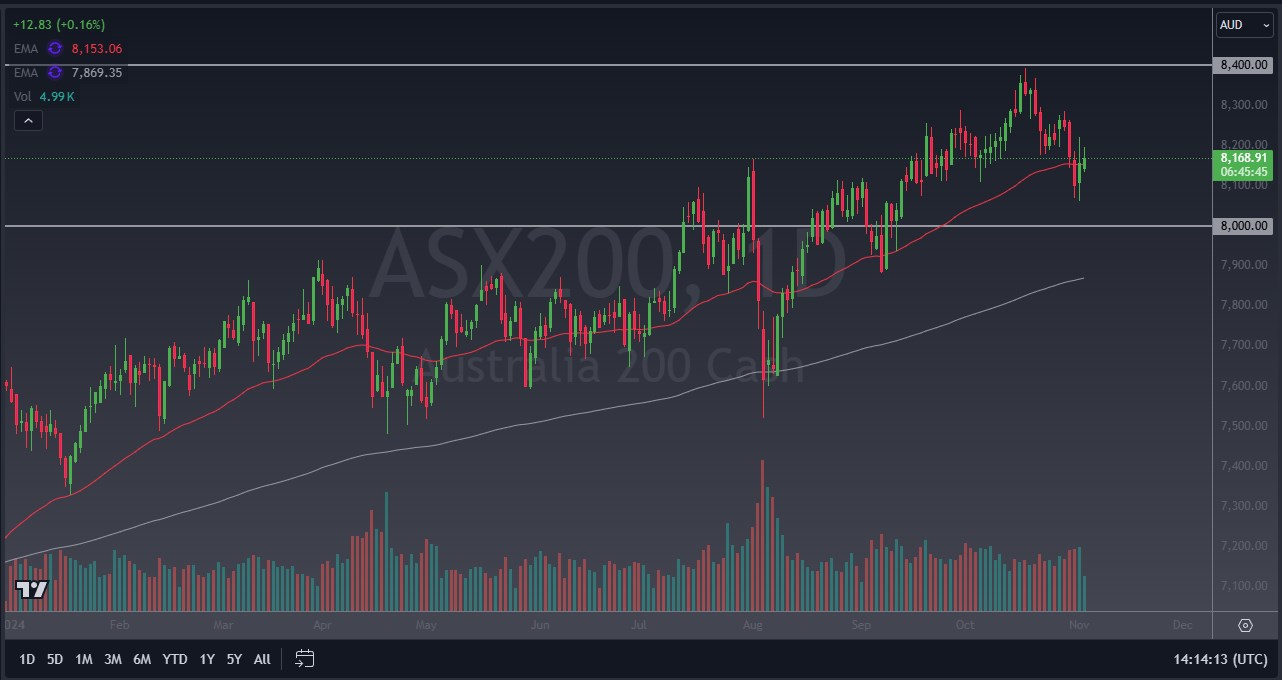
- ASX 200 Continues to Hang Onto the 50 Day EMA
- The energy sector did well on Monday
- US elections and RBA interest rate decision take centre stage
The ASX 200 currently sits at the 50 Day EMA which of course is a major technical level. More importantly, we have seen the market attempt to rally the last couple of days, which is a good sign, but at the same time, the argument can be made that the RBA interest rate decision on Tuesday is part of what the market seems to be waiting on.
Further complicating things, we have the Federal Reserve interest rate decision on Thursday, and of course on Tuesday we also have the U.S. elections, so there is plenty of news flow out there to cause chaos. That being said, the ASX 200 looks decidedly positive over the longer term, and there is nothing at the moment that seems glaringly negative.
CBA (Commonwealth Bank of Australia)
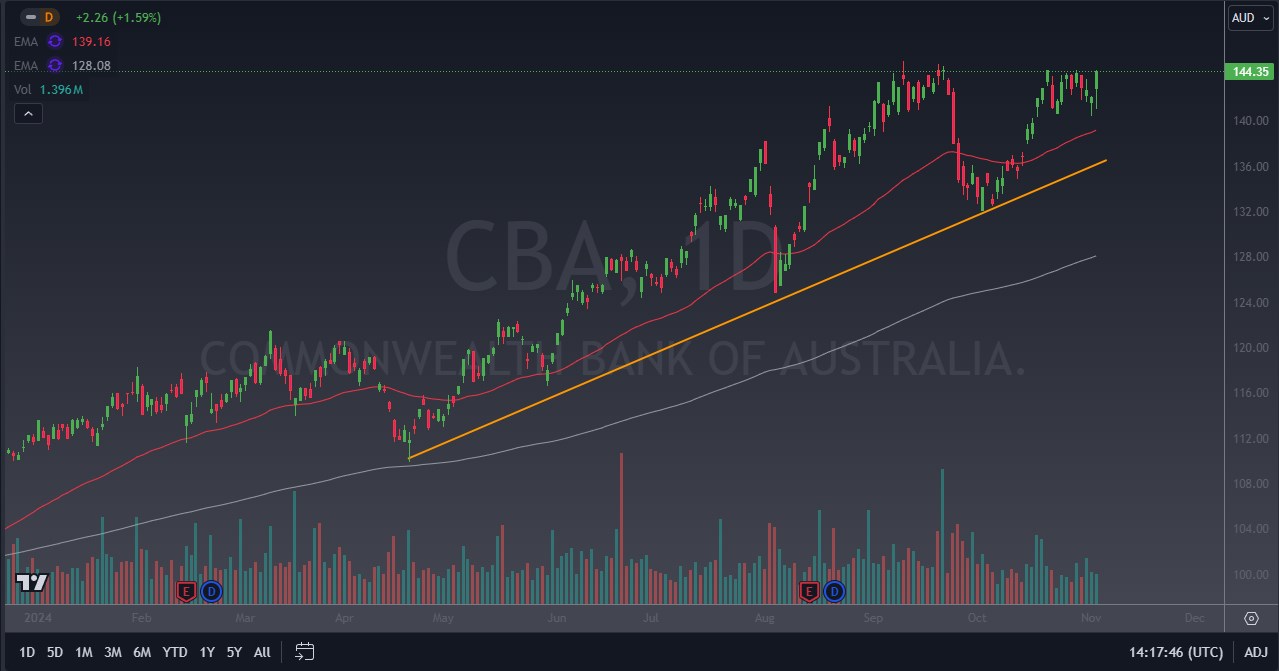
Commonwealth Bank of Australia gained 1.59% during the trading session on Monday, as the stock is doing everything it can to break out to a fresh, new high. The AU$144.50 level seems to be a bit of a “brick wall”, but after the big move the stock made on Monday, it may be just a matter of time before buyers can overcome that pressure.
Further adding upward pressure to the stock is that there is an AU$2.50 dividend, so many traders look at this through the prism of longer-term trading, giving it a bit of a “cushion” as time goes on. Also, for technical traders there could be a bit of an ascending triangle forming and getting ready to be broken out of.
Woodside Energy Group (WDS)
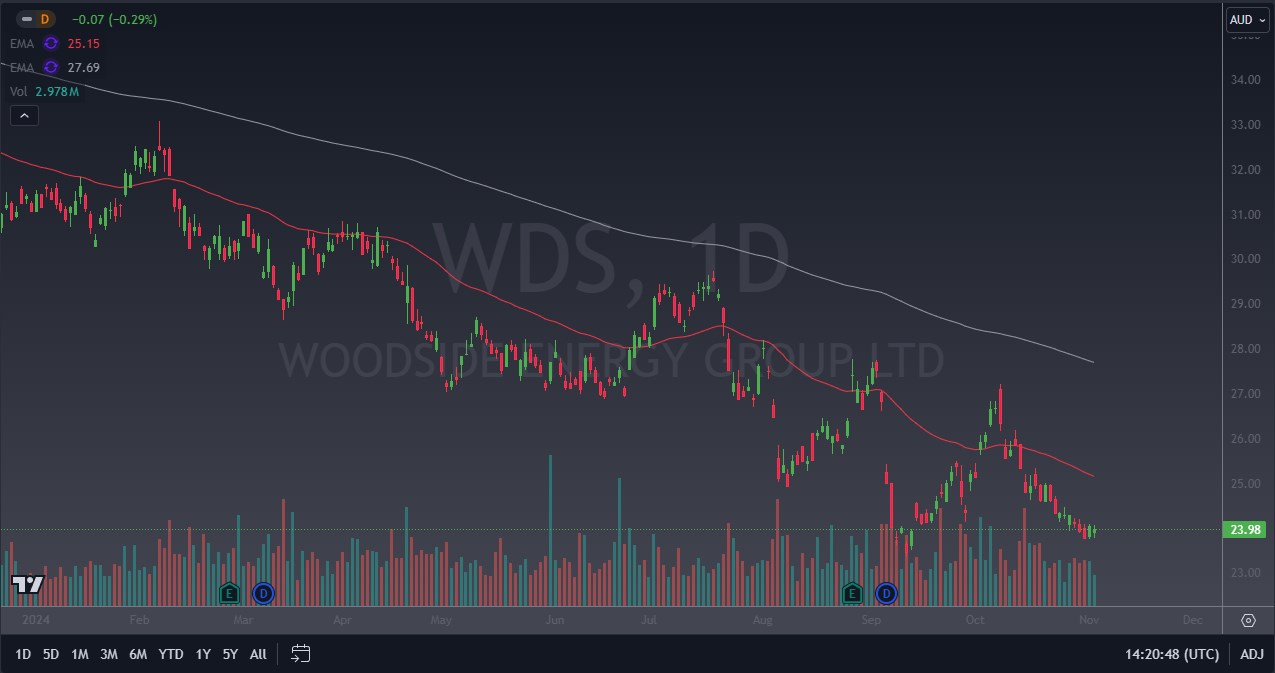
Woodside Energy Group had a slightly negative session on Tuesday, dropping 29c. The energy giant is down almost 30% for the last 12 months, so this should not be a surprise, especially as 7.98% lost over the last 30 days shows just how negative this market has been. The chart looks horrible, and as the stock has broken below the AU$24 level, it is testing a major swing low from before. That being said, some traders will look to WDS as a dividend play, as it has a juicy dividend of AU$1.02. However, that roughly 4% dividend is probably not reason enough to attract a lot of inflows. As things stand right now, this is a market that looks very bleak to say the least.
Transurban Group (TCL)
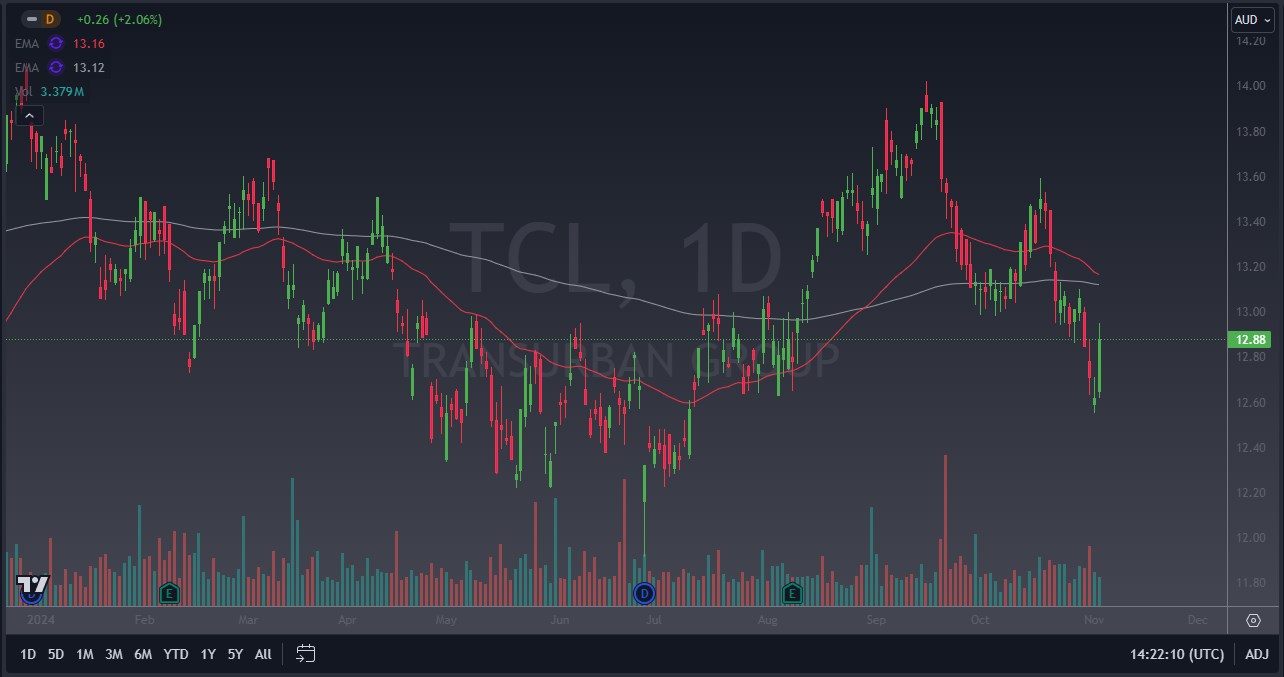
Transurban Group rallied 2.06% on Monday, as the industrial giant saw a massive bounce above the AU$4.50 level. At this point, the 200 Day EMA is sitting right around the AU$13 level, so there could be a bit of a battle ahead. This is a massive turnaround, but it’s worth noting that the volume is not extraordinarily high, so the question remains whether or not TCL just had a technical bounce, or if it’s something a little bit bigger. Nonetheless, this is a market that’s worth watching because it has the ability to offer a fair amount of value after the recent selloff from the AU$14 region.
Seven Group Holdings (SVW)
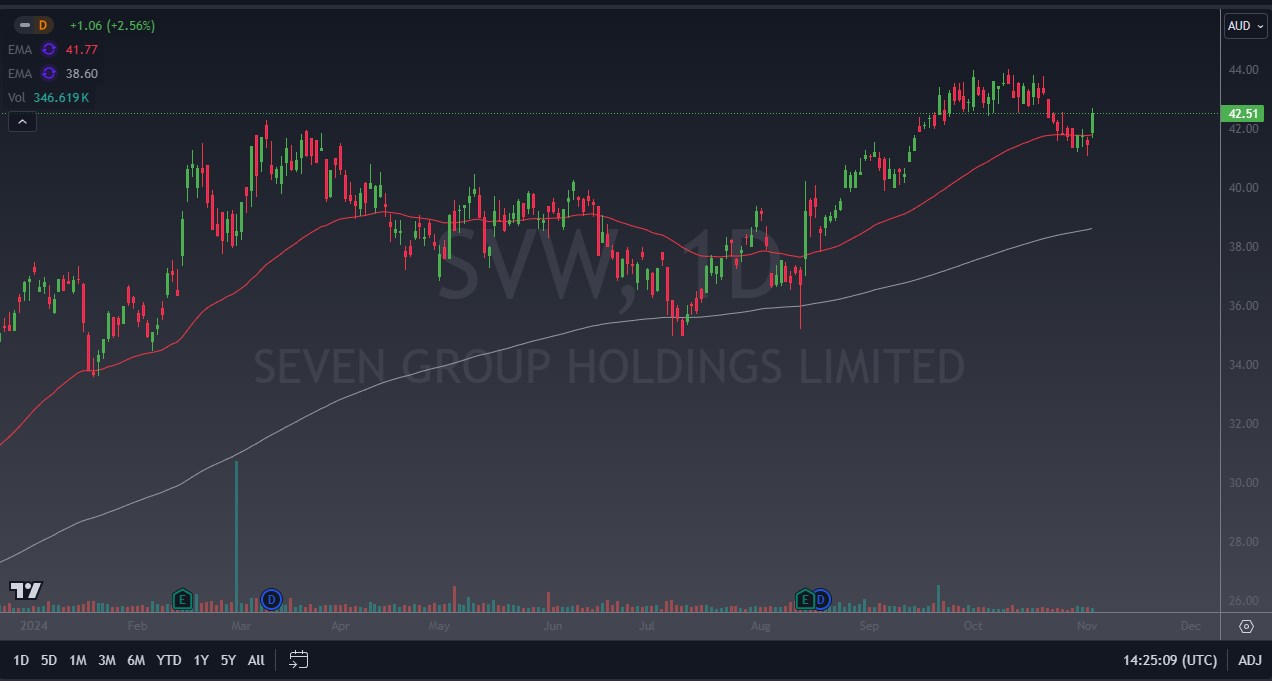
Seven Group Holdings rallied 2.56% on Monday, adding to the already impressive 45.33% for the previous 12 months. At this point, the market looks as if it is trying to get to the AU$44 level again, which was a recent swing high. From a technical analysis standpoint, if the market were to break above there then it would just simply be a continuation of the longer term uptrend that we have seen for so long. It’s also worth noting that the market recently bounced from the crucial 50 Day EMA as well. For what it is worth, the last earnings report was a surprise to the upside, and that might be part of what is playing out here.
Disclaimer: The material provided here has not been prepared in accordance with legal requirements designed to promote the independence of investment research and as such is considered to be a marketing communication. Whilst it is not subject to any prohibition on dealing ahead of the dissemination of investment research we will not seek to take any advantage before providing it to our client. No representation or warranty is given as to the accuracy or completeness of this information and therefore it shouldn’t be relied upon as such. Any research provided does not have regard to specific financial situations, needs or investment objectives. Vantage accepts no responsibility for any use that may be made of these comments and for any consequences that result. Consequently, any person acting on it does so entirely at their own risk. We advise any readers of this material to seek professional advice where necessary. Without the approval of Vantage, reproduction or redistribution of this information isn’t permitted.
-

Open Trading Account
Discover the endless trading possibilities with our cutting-edge platform, designed to empower our traders. Practice trading the markets with a free demo account today.
-

Download Vantage App
Trade on the go with the Vantage All-In-One Trading App, where smooth execution and market access come together in the palm of your hand.
-

Start Trading
Are you an existing user? Login to your account to start trading 1,000+ CFD products including forex, indices, gold, shares and more.
