
 Register
 Login
 Register





ASX 200 Reverses Early Gains as Markets React to Trade Headlines

Christopher Lewis >
Market Analyst
Christopher Lewis >
Market Analyst
 Updated Wed, 2025 June 11 07:56

- Australian stocks were relatively lackluster on Monday.
- US indices could very well lead the way.
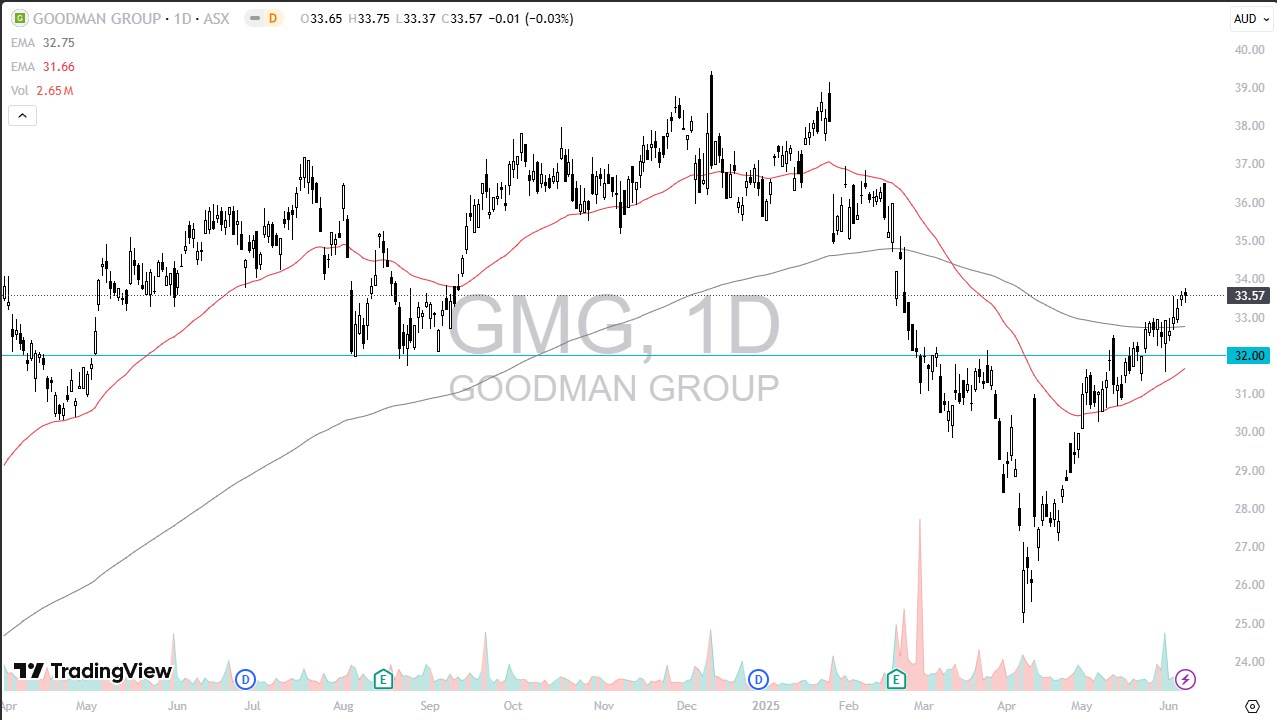
The Monday session initially saw the ASX 200 rally; however, most of those gains have since been reversed, indicating that the index remains within a challenging range to break out of. Given the solid performance over the past couple of months, it is reasonable to expect some consolidation or a pullback in momentum.
Nonetheless, broader global indices continue to exhibit strength, and Australia is unlikely to be an exception. The AU$8,500 level may draw attention as a potential area of interest, alongside other notable regions such as AU$8,350.
While global markets remain sensitive to headlines regarding tariffs and trade tensions, it is worth noting that the United States and China have resumed dialogue. Notably, China has eased certain restrictions on the export of rare earth materials to the United States for use in automobile manufacturing.
This gesture is being interpreted as a potential olive branch, and it may mark the beginning of meaningful progress. The Australian economy stands to benefit significantly from any positive developments in trade relations between the US and China.
BHP Group Limited (BHP)
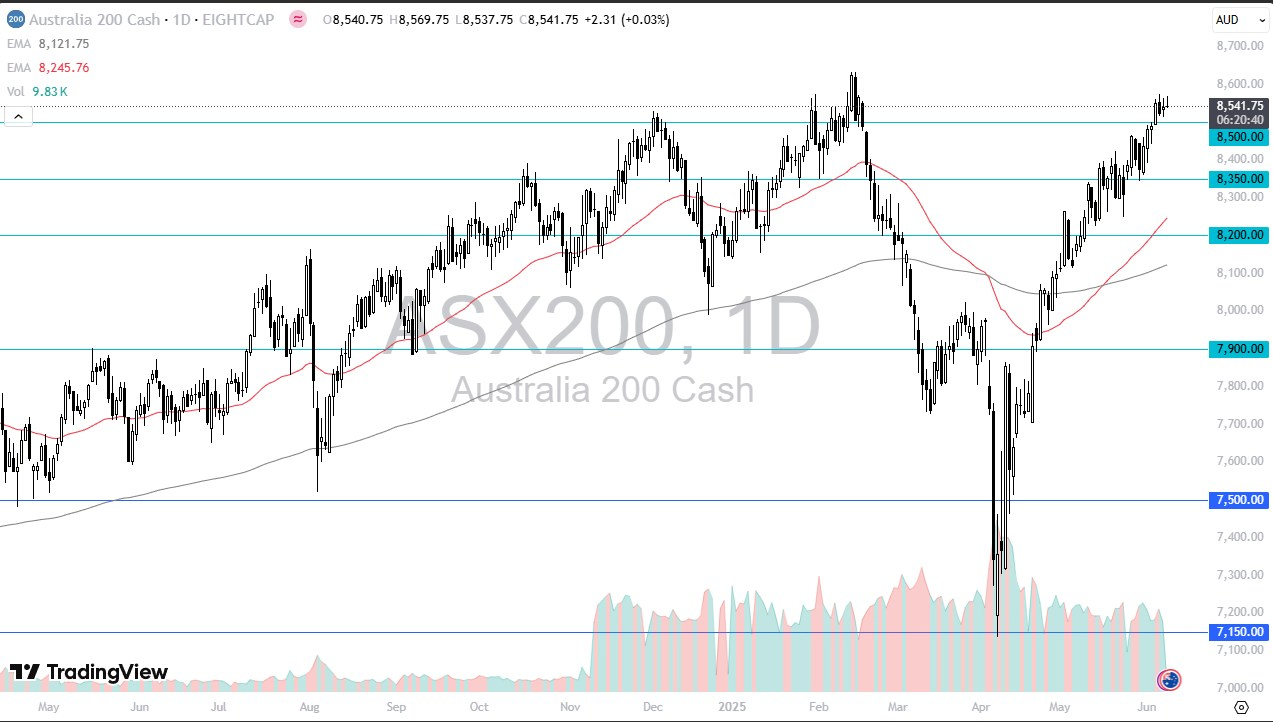
BHP Group rose by 0.66% during Monday’s trading session, with the materials sector expected to remain in focus amid ongoing developments between the United States and China. Over the past year, BHP Group has declined by 13.21%. This is not entirely surprising, given that raw material exports to China have slowed significantly as trade tensions have escalated.
Currently, the share price is hovering around the 50-day EMA, just below the key AU$38.75 level—an area that has attracted considerable market attention. While the broader trend has been bearish, there appears to be buying interest emerging around the AU$37.25 region.
ANZ Group Holdings Limited (ANZ)
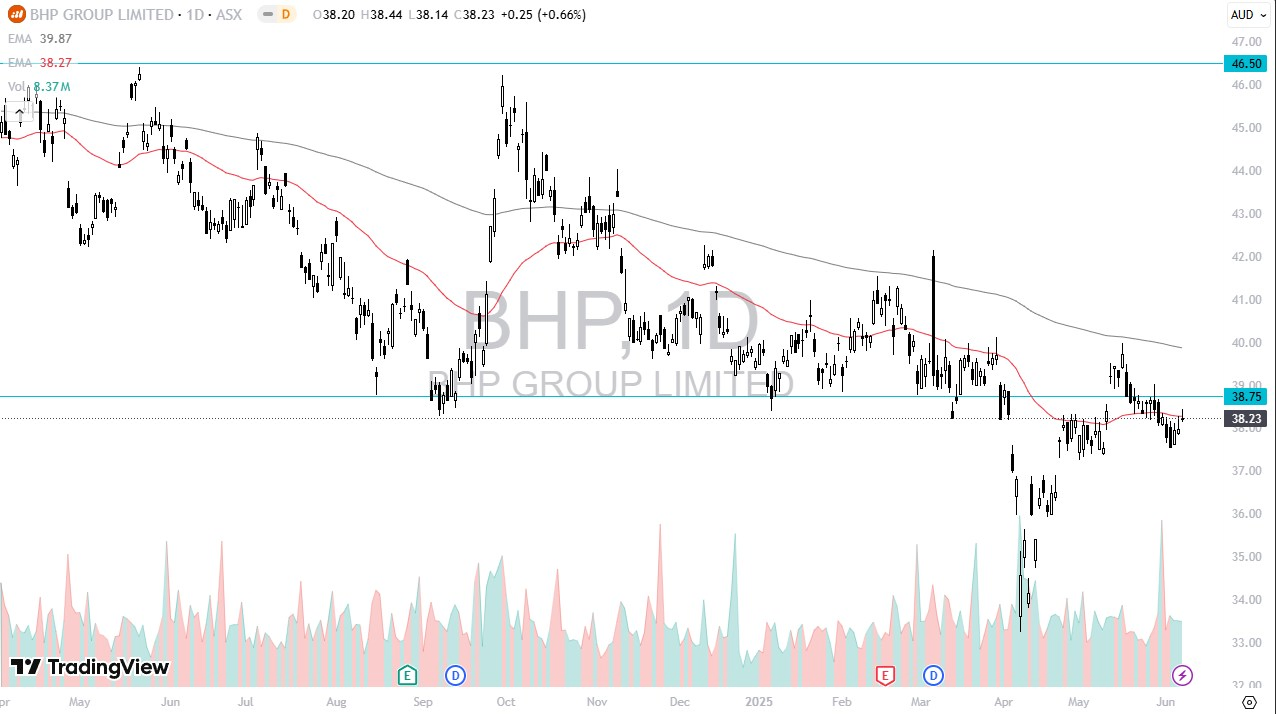
ANZ Group fell by 0.44% during Monday’s trading session, as market conditions remain choppy for the financial sector overall. ANZ has not been immune to this volatility. Over the past year, the stock has risen by 1.51%, but it has declined by 1.86% over the past month.
The company’s recent earnings call came in slightly better than expected. However, a significant resistance level remains near the AU$30 mark, which could limit further upside in the near term.
At present, the stock is trading above the 200-day EMA—a level closely watched by technical traders. It’s also worth noting that the market has recently broken out of a consolidation range to the upside, accompanied by a surge in trading volume. This may be viewed as a positive longer-term signal.
Goodman Group (GMG)
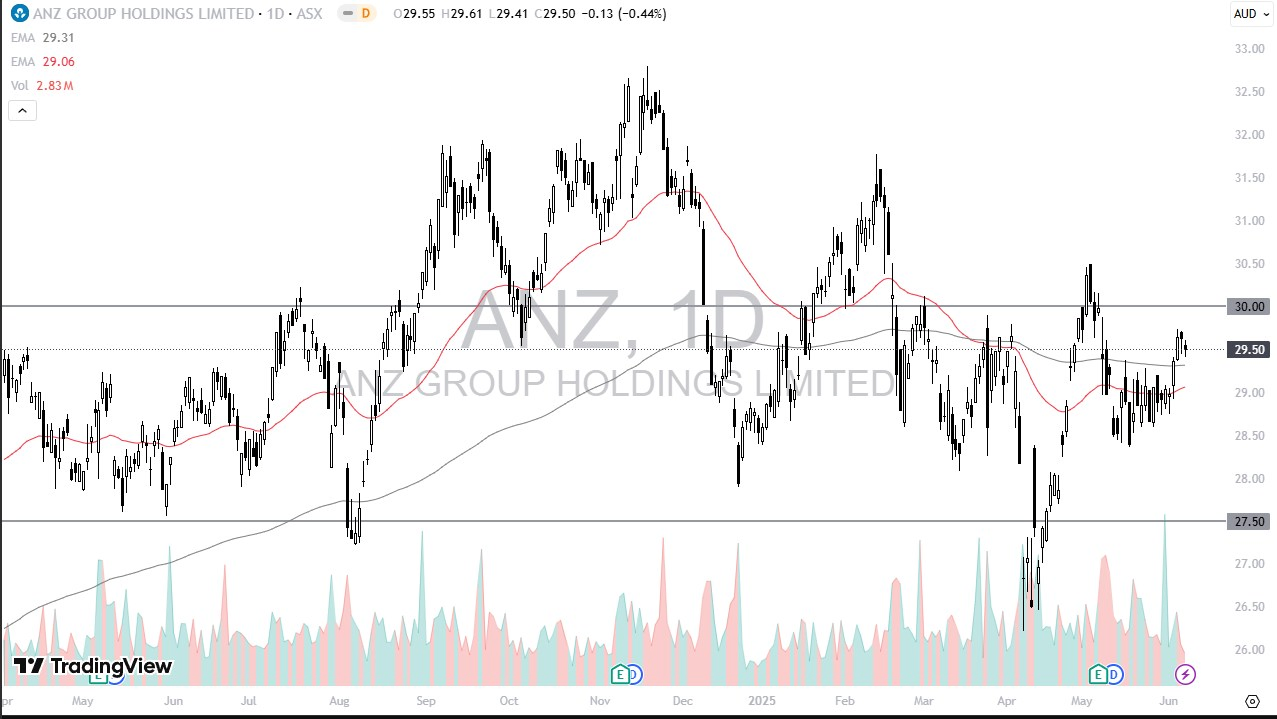
Goodman Group was relatively quiet during Monday’s trading session, edging down by just 0.03%. However, over the past month, GMG has delivered a strong return of 9.24%, suggesting that the current pause may be a natural consolidation after recent gains.
Despite this short-term strength, the stock remains down 4.30% over the past year, highlighting its overall volatility—common within the real estate sector. That said, the price is trading well above the 200-day EMA. Additionally, trading volume picked up during the recent breakout to the upside, which may be interpreted as a constructive sign for the longer term.
Disclaimer: The material provided here has not been prepared in accordance with legal requirements designed to promote the independence of investment research and as such is considered to be a marketing communication. Whilst it is not subject to any prohibition on dealing ahead of the dissemination of investment research we will not seek to take any advantage before providing it to our client. No representation or warranty is given as to the accuracy or completeness of this information and therefore it shouldn’t be relied upon as such. Any research provided does not have regard to specific financial situations, needs or investment objectives. Vantage accepts no responsibility for any use that may be made of these comments and for any consequences that result. Consequently, any person acting on it does so entirely at their own risk. We advise any readers of this material to seek professional advice where necessary. Without the approval of Vantage, reproduction or redistribution of this information isn’t permitted.
-

Open Trading Account
Discover the endless trading possibilities with our cutting-edge platform, designed to empower our traders. Practice trading the markets with a free demo account today.
-

Download Vantage App
Trade on the go with the Vantage All-In-One Trading App, where smooth execution and market access come together in the palm of your hand.
-

Start Trading
Are you an existing user? Login to your account to start trading 1,000+ CFD products including forex, indices, gold, shares and more.
