
 Register
 Login
 Register





ASX 200 Recovers Following Initial Monday Sell-Off

Christopher Lewis >
Market Analyst
Christopher Lewis >
Market Analyst
 Updated Tue, 2025 June 24 05:33

- Australia recovered after the initial “risk-off” selling
- Global indices demonstrated cautiously positive sentiment
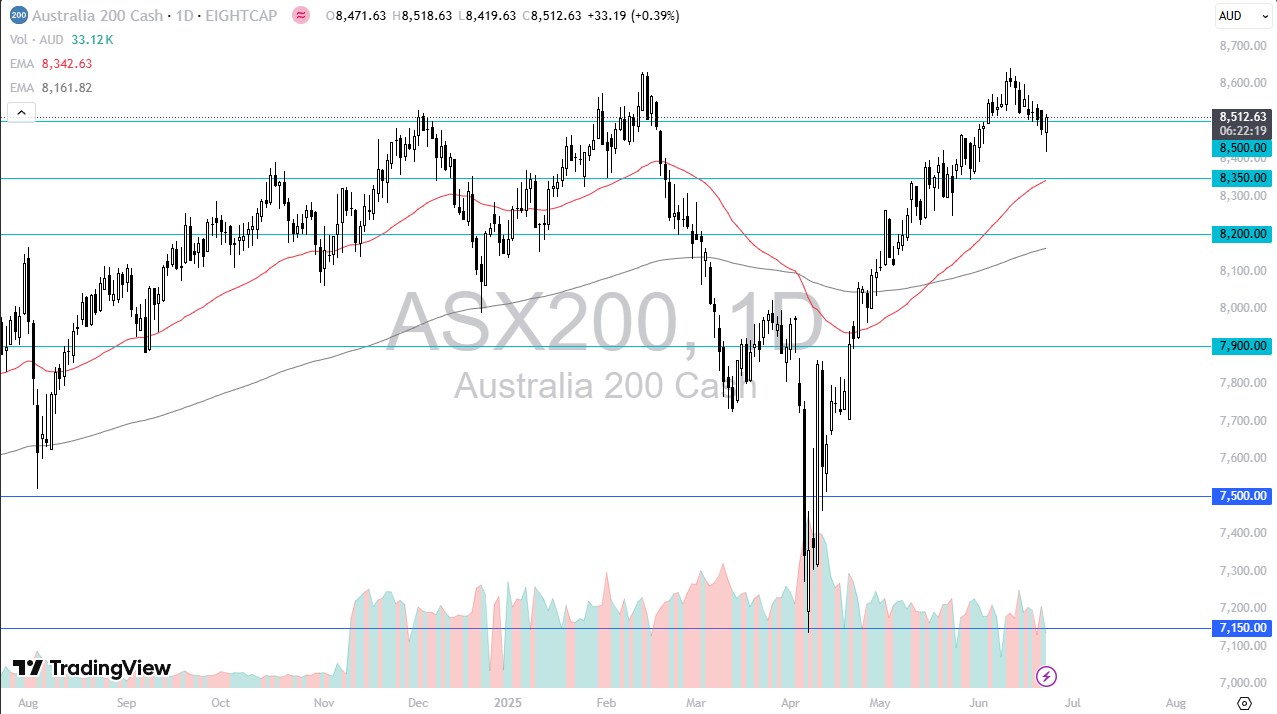
During Monday’s trading session, the ASX 200 initially declined. This was in line with the broader shift towards a “risk-off” mood across global markets. The decline followed news that American forces had bombed Iranian nuclear sites, raising concerns among traders about the potential for further escalation. Many investors responded by exiting positions.
However, after falling toward the AU$8,400 level, the ASX 200 attracted renewed buying interest and began recovering back toward the AU$8,500 level. For now, global indices appear to have a bias to move higher. The US market followed a similar pattern—an initial sell-off, followed by a swift rebound.
Macquarie Group Limited (MQG)
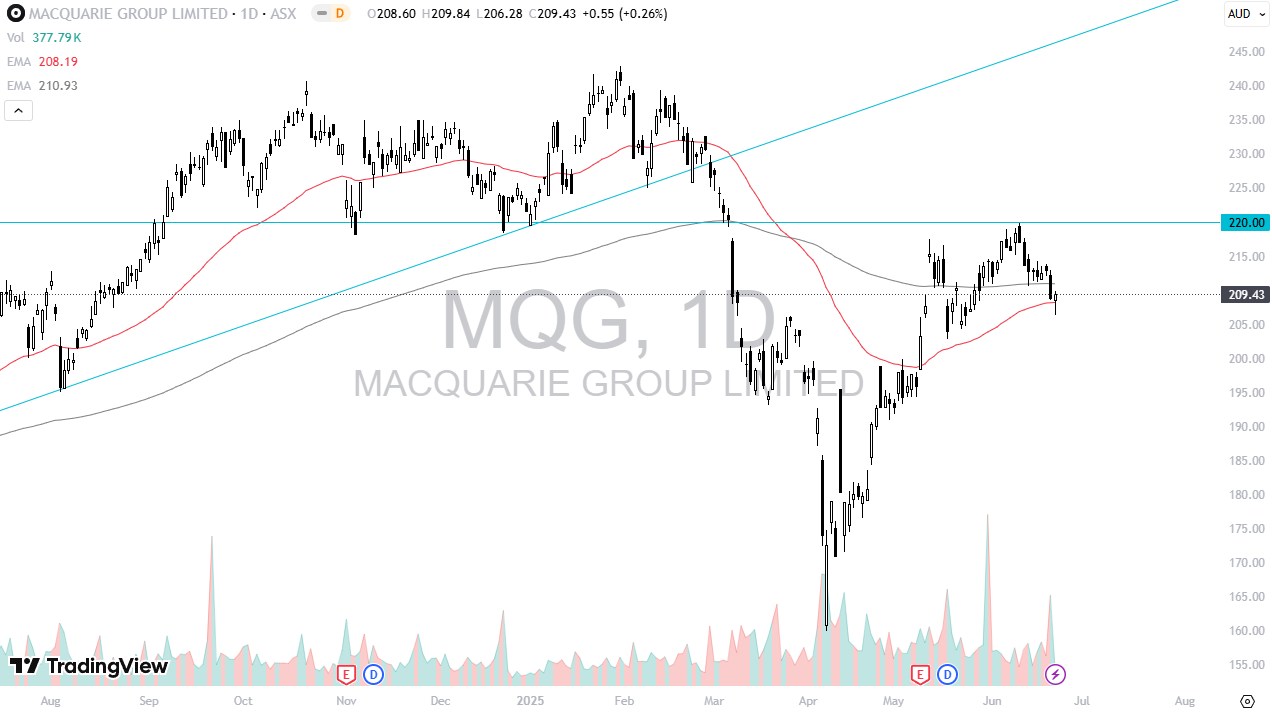
Macquarie Group Limited rose 0.26% during the session after an early decline. Over the past year, MQG has gained 5.23%, including a 1.89% rise in the last month.
The company is nearing an AU$80 billion market cap, with its share price approaching AU$210. Technical traders may find the current setup appealing, as a hammer pattern has formed while the price sits at the 50-day EMA and moves towards the 200-day EMA. The next key resistance is around AU$220, which bullish traders may be targeting.
Sigma Healthcare Limited (SIG)
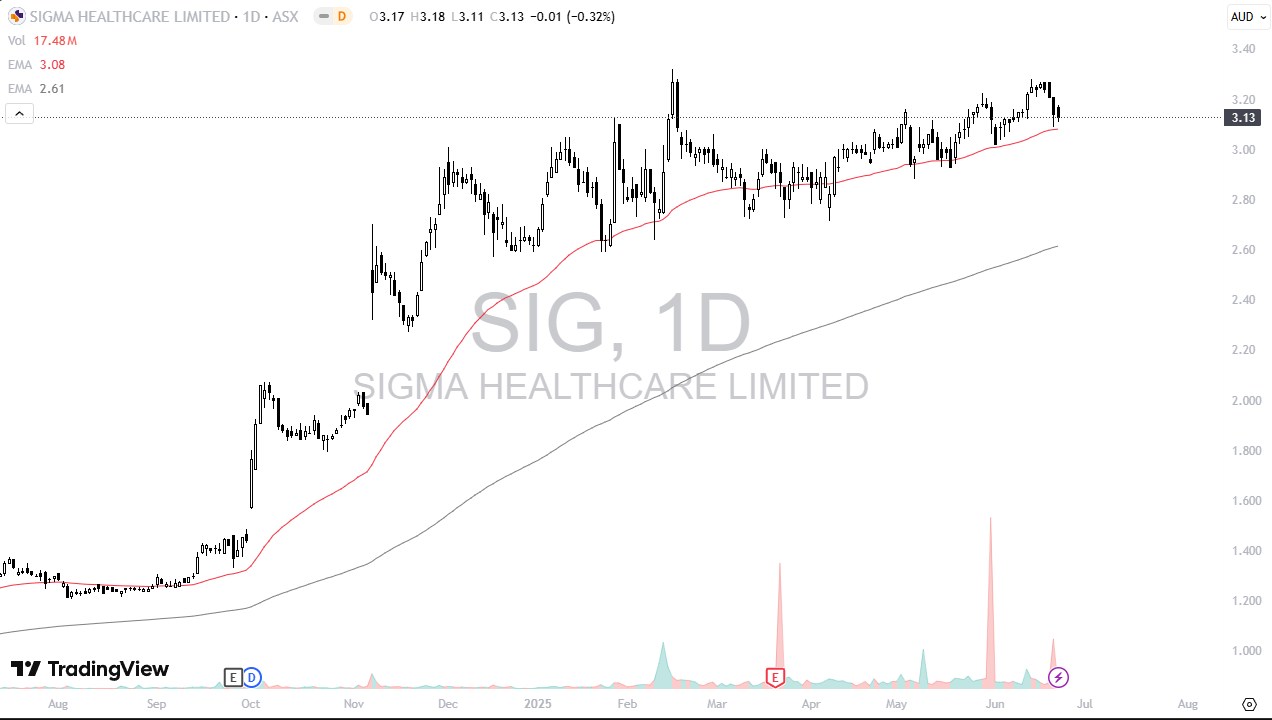
Sigma Healthcare Limited slipped 0.32% during Monday’s session. However, this minor pullback comes after an impressive 139.85% gain over the past 12 months.
The stock had dipped further earlier in the day but recovered as a more “risk-on” mood returned to the market. It is currently hovering near the 50-day EMA and remains one of the ASX 200’s top performers over the past year. Momentum continues to favour the upside, with the price holding well above the AU$3 level.
Commonwealth Bank of Australia (CBA)
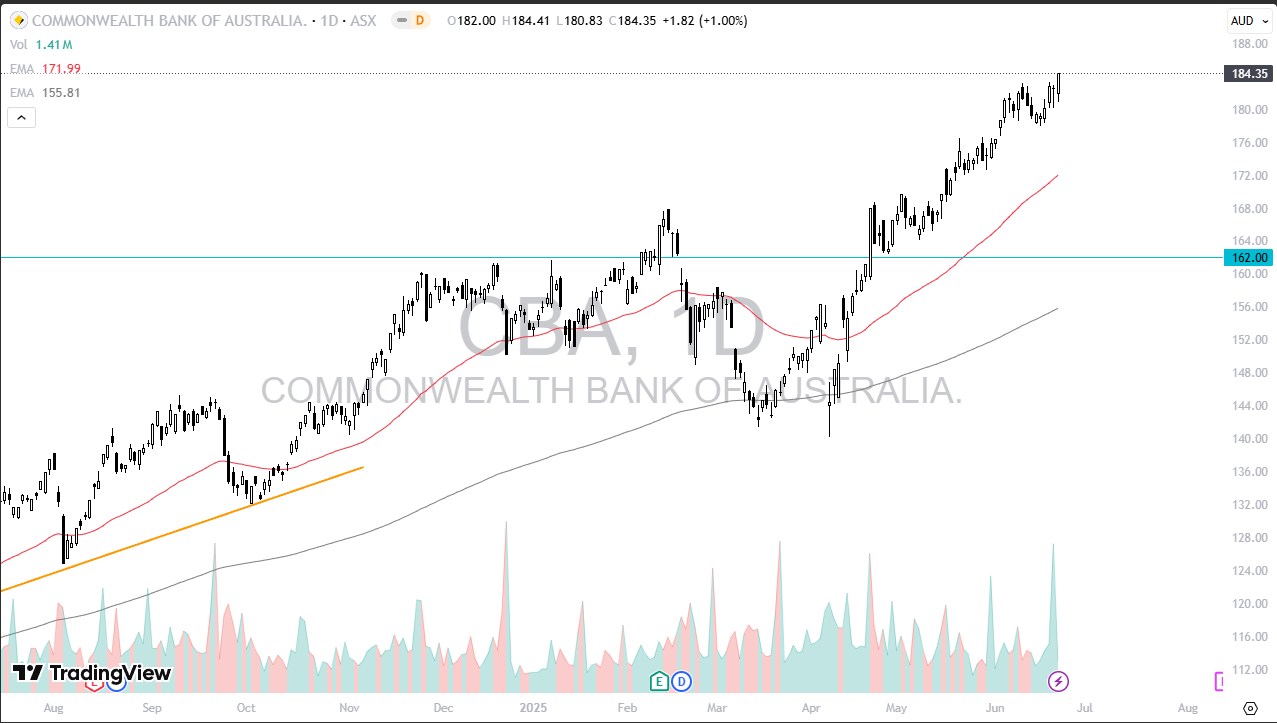
Commonwealth Bank of Australia rose 1% during the session, extending its 44.38% gain over the past 12 months. In the past month alone, CBA has climbed 6.73%, with the stock now approaching the AU$185 level.
CBA recently announced discounted home equity loans for energy upgrades, a move some analysts believe could attract additional business. The stock remains in a strong uptrend, with buyers quick to step in on any signs of value.
With no earnings call scheduled until 13 August, the market may lack certain near-term catalysts. The 50-day EMA sits much lower at AU$172, while Monday’s close came in at AU$184.35.
Disclaimer: The material provided here has not been prepared in accordance with legal requirements designed to promote the independence of investment research and as such is considered to be a marketing communication. Whilst it is not subject to any prohibition on dealing ahead of the dissemination of investment research we will not seek to take any advantage before providing it to our client. No representation or warranty is given as to the accuracy or completeness of this information and therefore it shouldn’t be relied upon as such. Any research provided does not have regard to specific financial situations, needs or investment objectives. Vantage accepts no responsibility for any use that may be made of these comments and for any consequences that result. Consequently, any person acting on it does so entirely at their own risk. We advise any readers of this material to seek professional advice where necessary. Without the approval of Vantage, reproduction or redistribution of this information isn’t permitted.
-

Open Trading Account
Discover the endless trading possibilities with our cutting-edge platform, designed to empower our traders. Practice trading the markets with a free demo account today.
-

Download Vantage App
Trade on the go with the Vantage All-In-One Trading App, where smooth execution and market access come together in the palm of your hand.
-

Start Trading
Are you an existing user? Login to your account to start trading 1,000+ CFD products including forex, indices, gold, shares and more.
