
 Register
 Login
 Register





ASX 200 has a Mixed Day on Monday

Christopher Lewis >
Market Analyst
Christopher Lewis >
Market Analyst
 Updated Tue, 2024 September 24 08:22

- ASX 200 has been noisy to say the least.
- The global central bank actions continue to favor cutting and easy money.
- The materials sector continues to watch gold and copper closely.
The ASX 200 was very noisy on Monday, as the market continues to look for some kind of clarity. After all, there are a lot of traders focusing on the idea of central banks adding liquidity, but at the same time, there is also a lot of concern when it comes to the idea of slowing global economic momentum.
Reece Ltd (REH)
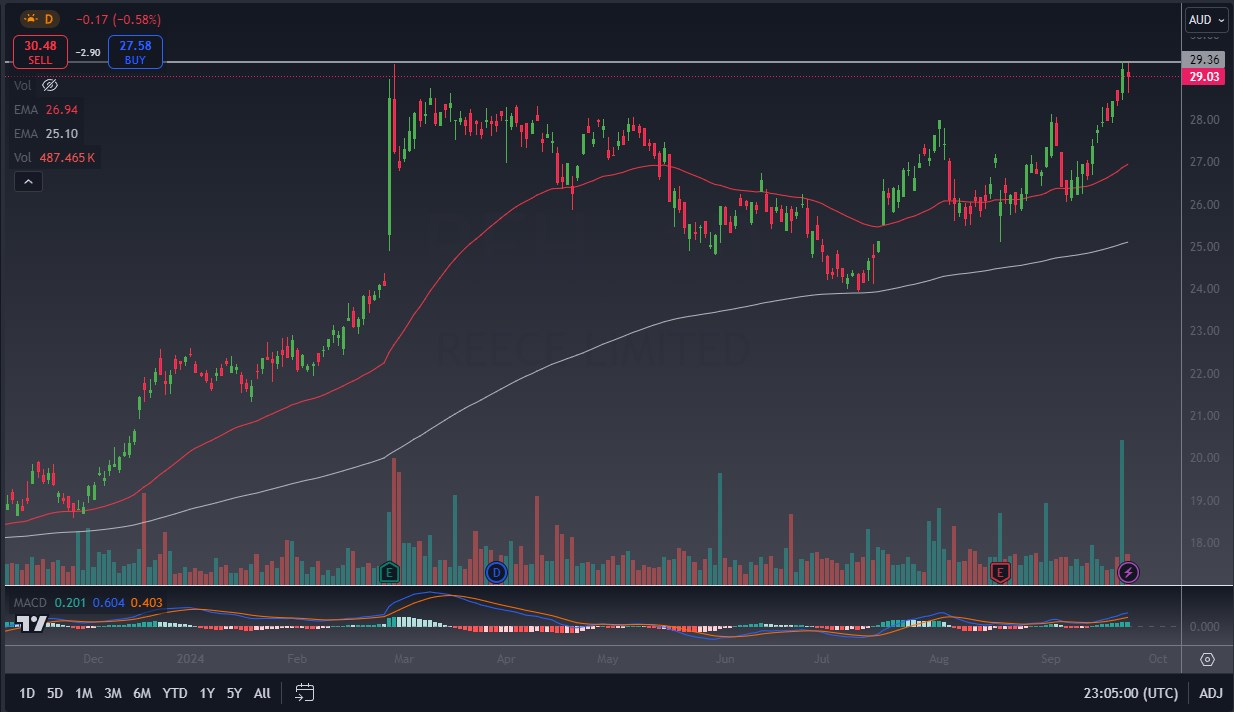
Reece Limited dropped 0.58% for the session on Monday, as the industrial giant is currently testing a major resistance barrier. In fact, the markets are doing everything they can to finally reach above the AU$30 level, an area that looks as if it will continue to be a massive issue to deal with. Major trading houses are all over the place with the idea of price targets as of late. Morgans has dropped its forecast 5%, with a target $AU21, while Goldman Sachs has raised its target by 2%, suggesting it will reach $AU23.70 – which is much lower than where we are right now. All of that being said, the stock has rallied 55.82% for the last year.
Northern Star Resources (NST)
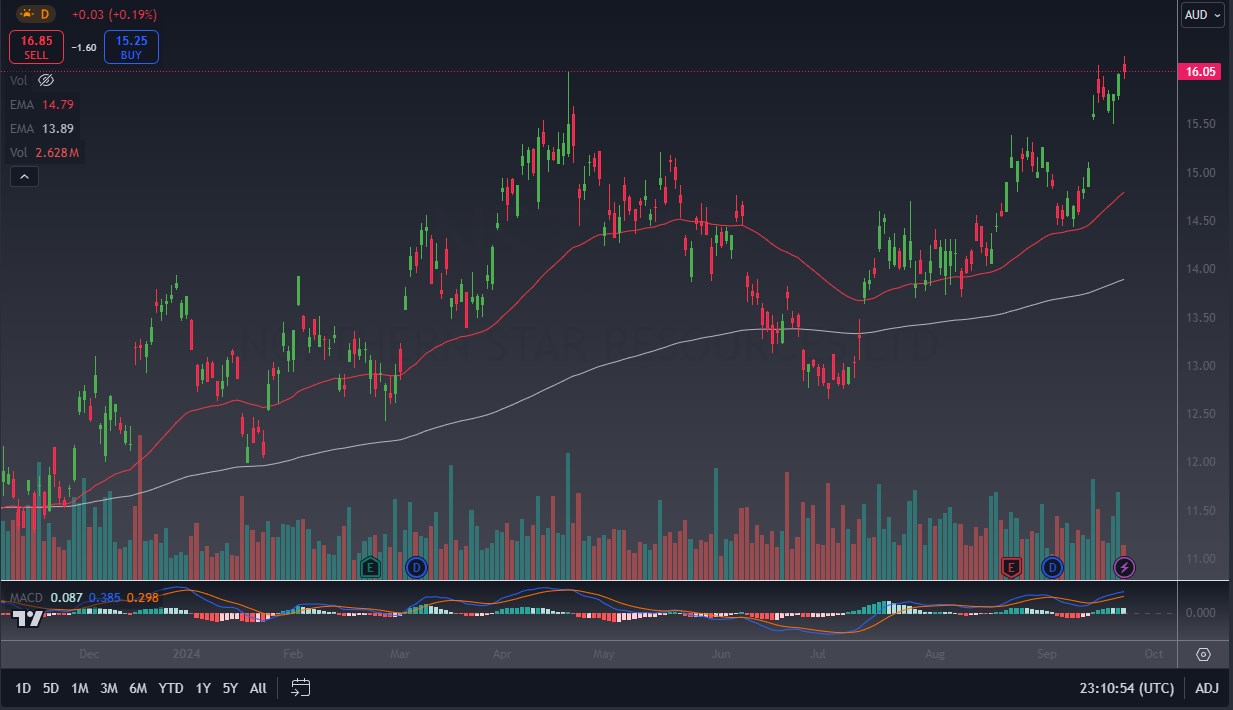
Northern Star was slightly positive during the session, gaining 19 basis points. The materials giant has been very strong as of late, as it has gained 5.87% for the last month alone. The rising gold prices around the world will continue to be a significant driver over the longer term, as the market continues to see a lot of demand for metals from central banks, and of course, a lot of retail holders coming into the market. The market is currently hovering around the $AU16 level, an area that previously has been very resistant to buyers. At this point, the market looks as if it is going to continue to look at this as a potential “back doorway” to increase exposure to gold and other materials.
NextDC (NXT)
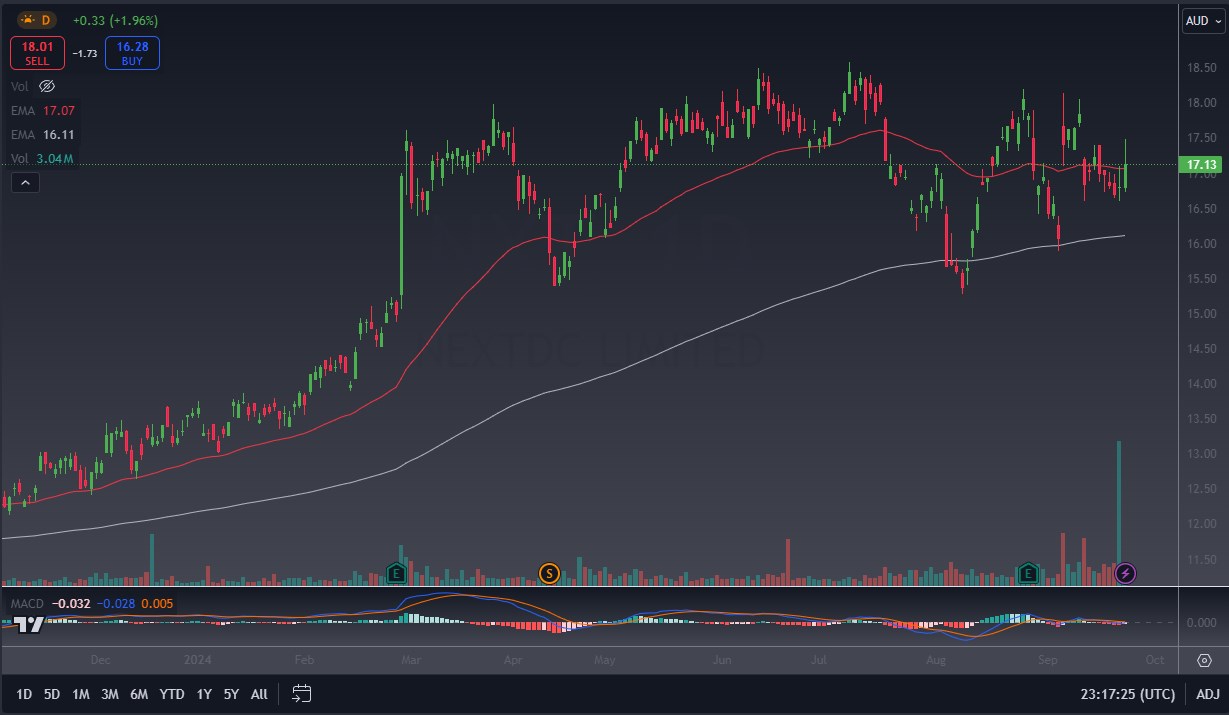
NextDC rallied almost two full percent for the Monday session, as the market continues to warm to the idea of holding shares of the IT giant. The stock is up 38.48% for the last 12 months, but over the course of the last month, it has fallen 2.89%. Because of this, it is easy to see why a lot of traders will perhaps expect volatility in this company, but it is also worth noting that the market has been somewhat rangebound since late February and is essentially in the middle of that overall range. Technical traders will look at the 50 Day EMA slicing through the candlestick of the day as important, as it shows a somewhat sideways attitude as well.
Dexus (DXS)
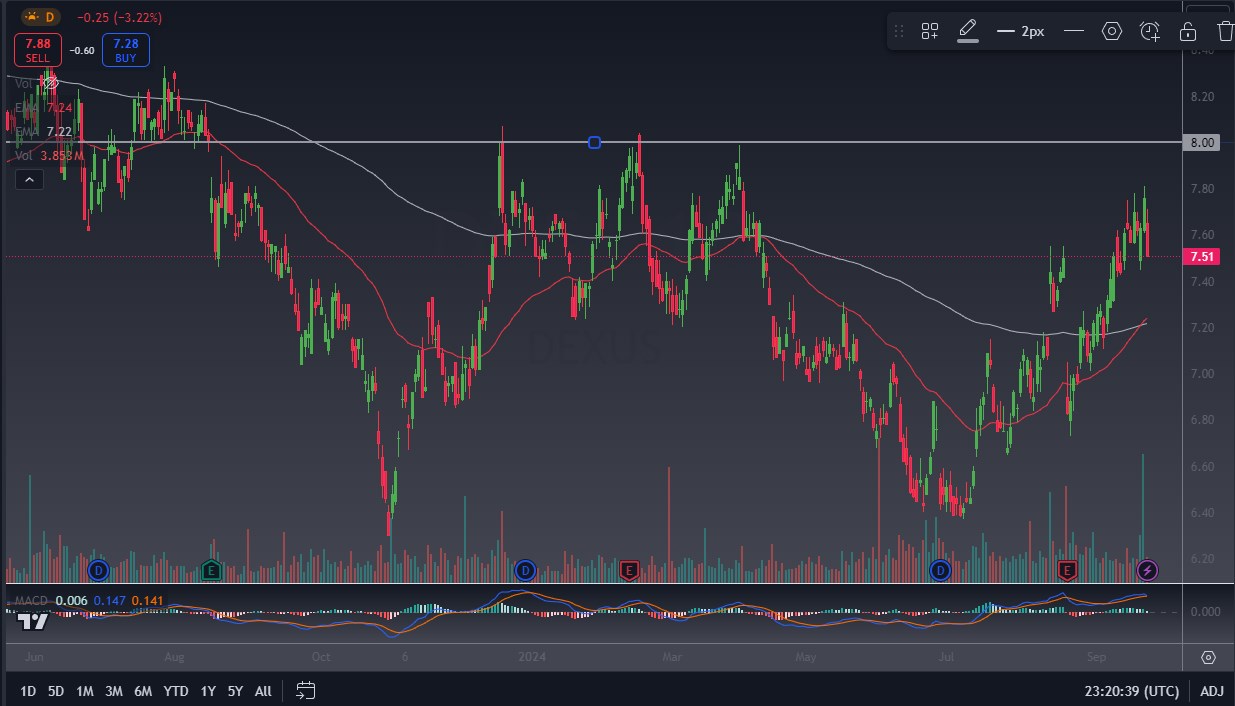
Dexus, the real estate company, had a rough start to the week, as it dropped 3.22% on Monday. Ultimately, this is a market that continues to see a lot of resistance near the $AU8 level, and the selloff on Monday suggests that we will continue to see a lot of troubles. Furthermore, it is also possible that a lot of people believe this market is overbought in the short term, and that a bit of a dip is probably necessary. For those who are longer-term traders, it is a potential signal that is going to be important below, with the 50 Day EMA and the 200 Day EMA just crossed, kicking off the “golden cross.”
Disclaimer: The material provided here has not been prepared in accordance with legal requirements designed to promote the independence of investment research and as such is considered to be a marketing communication. Whilst it is not subject to any prohibition on dealing ahead of the dissemination of investment research we will not seek to take any advantage before providing it to our client. No representation or warranty is given as to the accuracy or completeness of this information and therefore it shouldn’t be relied upon as such. Any research provided does not have regard to specific financial situations, needs or investment objectives. Vantage accepts no responsibility for any use that may be made of these comments and for any consequences that result. Consequently, any person acting on it does so entirely at their own risk. We advise any readers of this material to seek professional advice where necessary. Without the approval of Vantage, reproduction or redistribution of this information isn’t permitted.
-

Open Trading Account
Discover the endless trading possibilities with our cutting-edge platform, designed to empower our traders. Practice trading the markets with a free demo account today.
-

Download Vantage App
Trade on the go with the Vantage All-In-One Trading App, where smooth execution and market access come together in the palm of your hand.
-

Start Trading
Are you an existing user? Login to your account to start trading 1,000+ CFD products including forex, indices, gold, shares and more.
