
 Register
 Login
 Register





ASX 200 Eyes Breakout as Global Sentiment Remains Cautiously Optimistic

Christopher Lewis >
Market Analyst
Christopher Lewis >
Market Analyst
 Updated Thu, 2025 July 10 08:29

- Global equities remain supported by bullish sentiment, with markets seeking catalysts for further upside.
- Australia’s market direction continues to be shaped by developments in the US and China.
- Ongoing volatility in commodity prices plays a key role in driving ASX 200 fluctuations.
During Wednesday’s trading session, the ASX 200 dipped briefly before recovering and showing renewed strength. This pattern is reflected across many global indices. It suggests that equities traders still lean bullish and are searching for opportunities to buy into financial assets.
The ASX 200 tends to be heavily influenced by the financial and commodity sectors. Australia plays a key role as a financial hub in its region and as a leading exporter of resources like iron, gold, and copper—particularly to China.
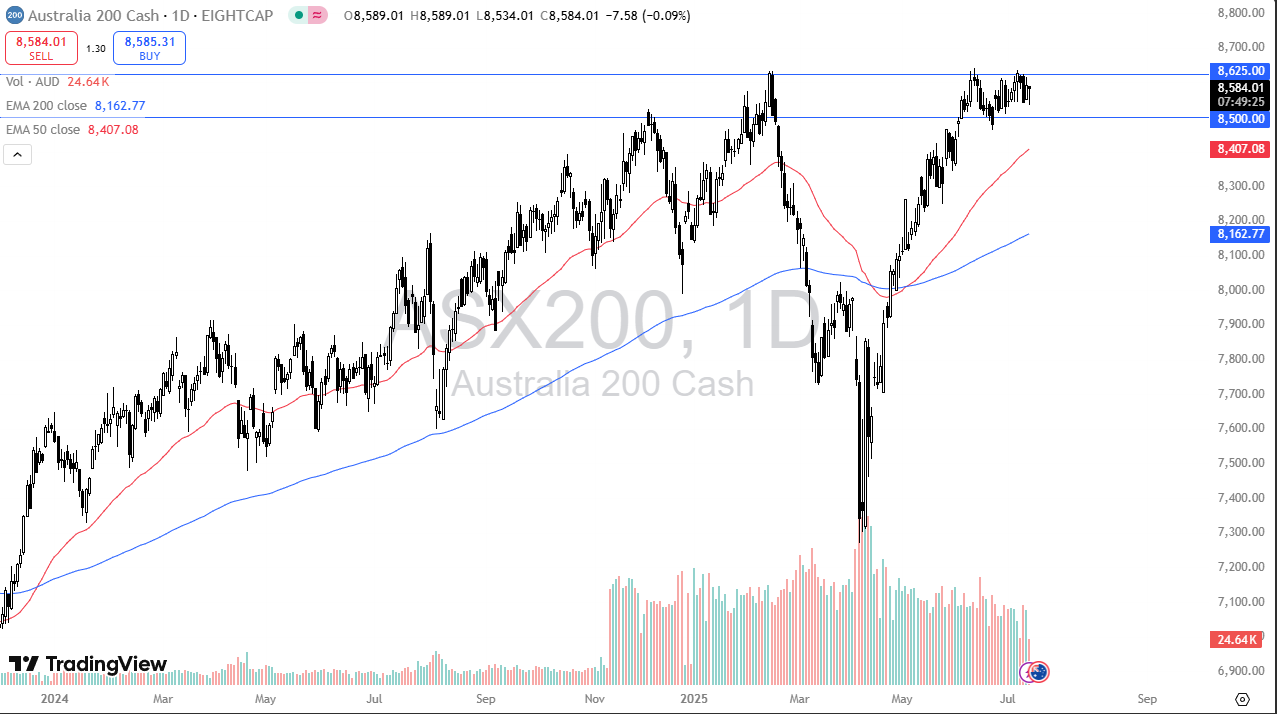
At present, global trade concerns remain in focus. The market appears to be attempting to push above the key AU$8,625 level. This price zone has acted as firm resistance in recent weeks.
A clear breakout could trigger stop-loss buying, forcing short sellers to cover their positions. It’s also worth noting that the market has rallied strongly since hitting its recent low. The sideways movement seen over the past few weeks may simply reflect a consolidation phase, helping prices stabilise at these higher levels.
Fortescue Limited (FMG)
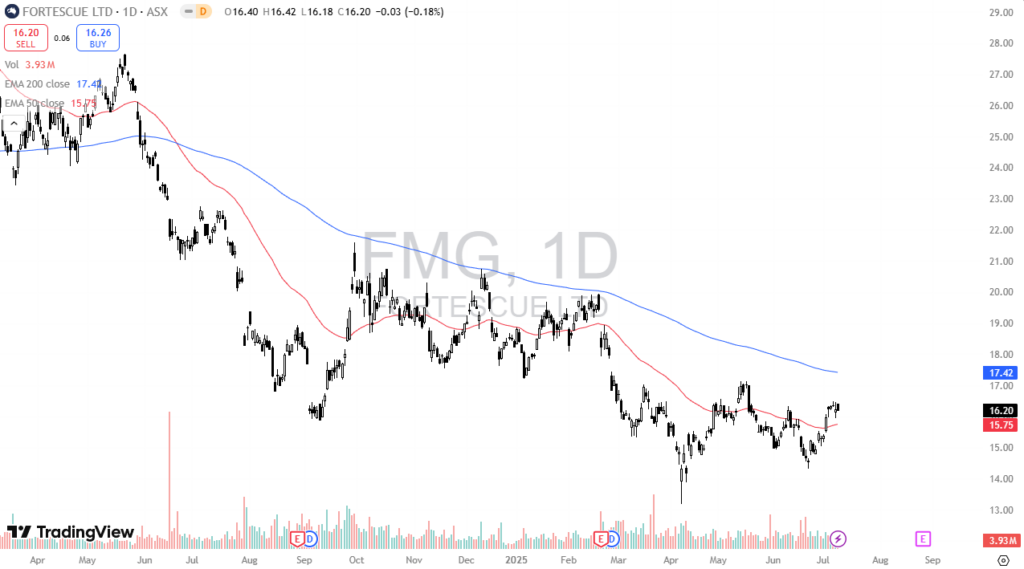
Fortescue Limited ended the session slightly lower, down 0.19%. However, over the past month, the stock has been gradually recovering from earlier losses. In the last 30 days alone, it has gained 3.51%.
These gains come after a significant decline over the past year, with the stock still down 25.89% overall. For technical traders, it’s worth noting that the price has recently broken above the 50-day EMA and is now testing that level as support.
In other news, Fortescue has announced a new investment of AU$2.8 million. The funds will go towards building a pilot plant in South Australia to support its research and development initiatives.
ANZ Group Holdings (ANZ)
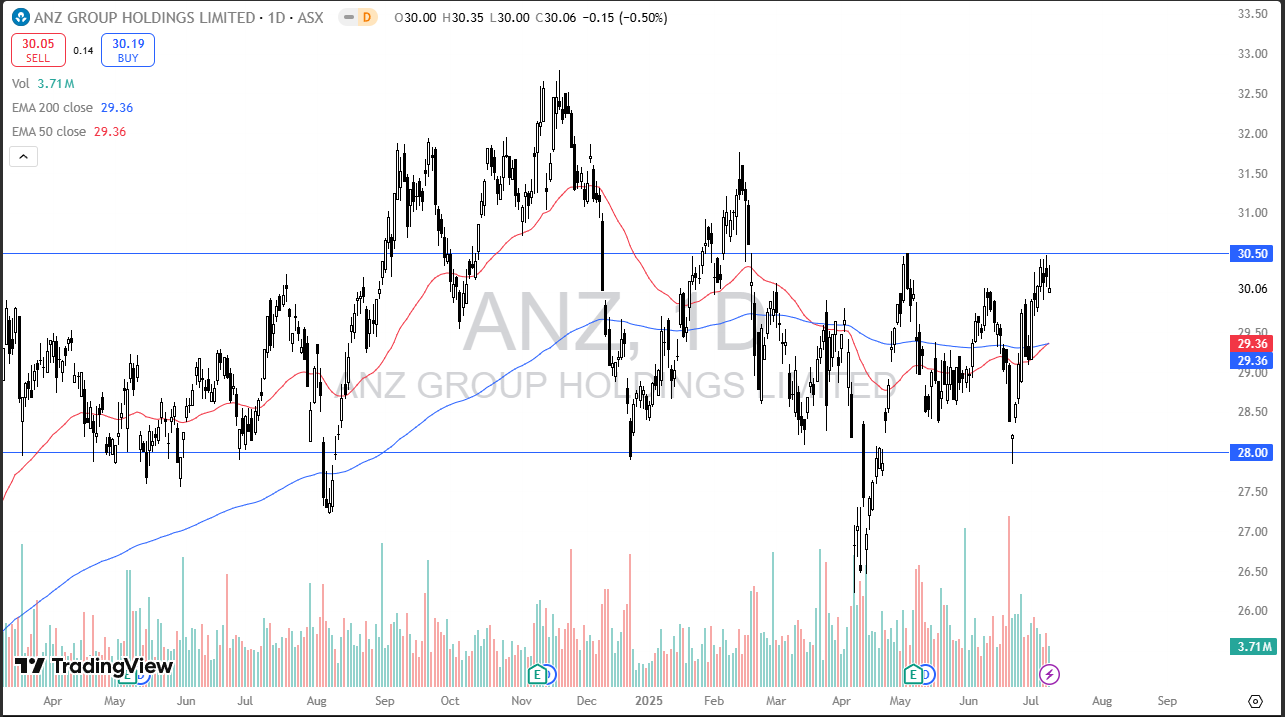
ANZ Group Holdings slipped slightly on Wednesday, falling by 0.50%. The price has been consolidating for a while, trading between AU$28 at the lower end and AU$30.50 at the upper end. This sideways pattern suggests the market may continue to face short-term resistance.
Despite this consolidation, ANZ has managed to gain 2.63% over the past 12 months. That steady performance may continue to draw interest from range-bound traders. For now, the market appears comfortable within its current range. Traders may continue to monitor these key levels for signs of a breakout or further consolidation.
BHP Group Limited (BHP)
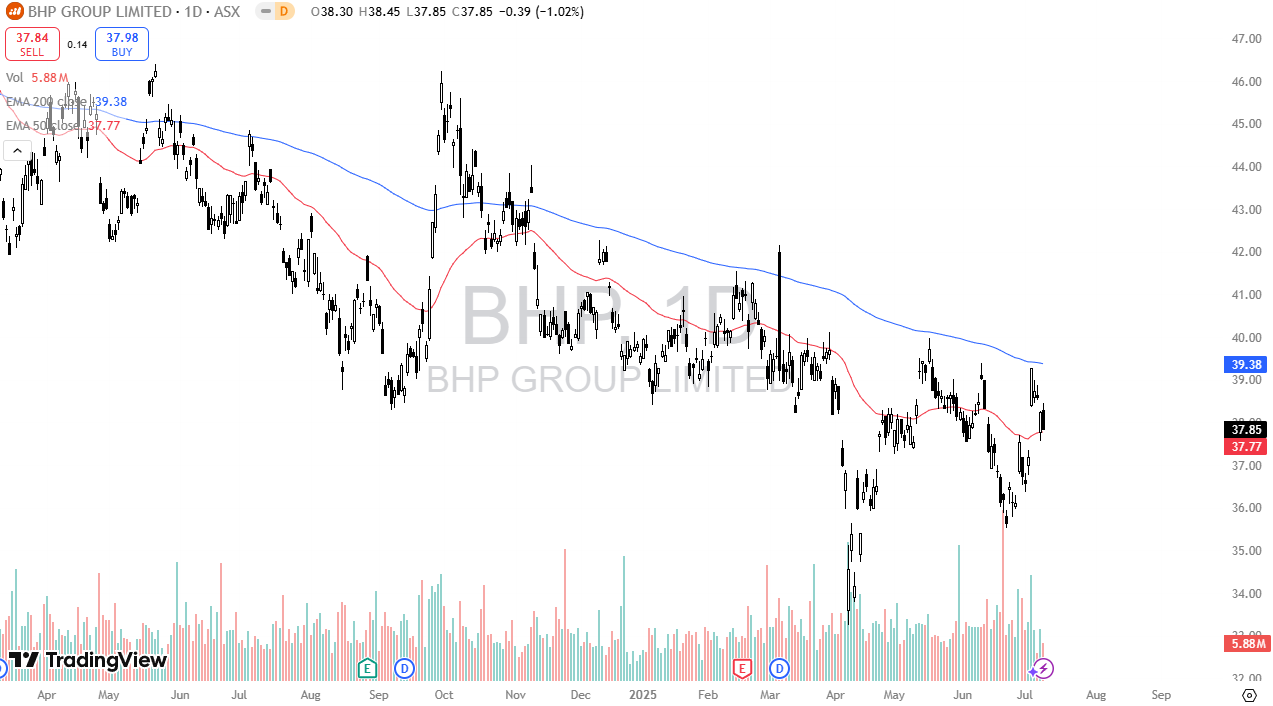
BHP Group Limited fell 1.02% during Wednesday’s trading session, capping off what has otherwise been a relatively flat month. Over the past year, the company has declined by 13.47%, reflecting a steady downward trend.
Technical traders have been watching the 200-day EMA closely, as it has acted as a key resistance level. This was the point from which the stock began its current decline 45 sessions ago. BHP is now facing pressure from multiple directions. One major factor is the recent rise in copper prices, driven by US tariffs on copper imports, which has raised supply chain concerns.
In addition, labour costs have gone up following a ruling by Australia’s Fair Work Commission. The decision granted equal wages to 2,200 coal miners across three Queensland mines, raising average pay for BHP miners by AU$30,000 per year. With both higher input costs and rising wage obligations, BHP continues to face significant headwinds.
Disclaimer: The material provided here has not been prepared in accordance with legal requirements designed to promote the independence of investment research and as such is considered to be a marketing communication. Whilst it is not subject to any prohibition on dealing ahead of the dissemination of investment research we will not seek to take any advantage before providing it to our client. No representation or warranty is given as to the accuracy or completeness of this information and therefore it shouldn’t be relied upon as such. Any research provided does not have regard to specific financial situations, needs or investment objectives. Vantage accepts no responsibility for any use that may be made of these comments and for any consequences that result. Consequently, any person acting on it does so entirely at their own risk. We advise any readers of this material to seek professional advice where necessary. Without the approval of Vantage, reproduction or redistribution of this information isn’t permitted.
-

Open Trading Account
Discover the endless trading possibilities with our cutting-edge platform, designed to empower our traders. Practice trading the markets with a free demo account today.
-

Download Vantage App
Trade on the go with the Vantage All-In-One Trading App, where smooth execution and market access come together in the palm of your hand.
-

Start Trading
Are you an existing user? Login to your account to start trading 1,000+ CFD products including forex, indices, gold, shares and more.
