
 Register
 Login
 Register





ASX 200 Edges Higher as Markets Eye US–China Trade Deal

Christopher Lewis >
Market Analyst
Christopher Lewis >
Market Analyst
 Updated Thu, 2025 June 12 08:59

- Australian index primed to benefit from US–China deal.
- Mixed results during the Australian session.
- Traders continue to look to China for direction in Australian markets.
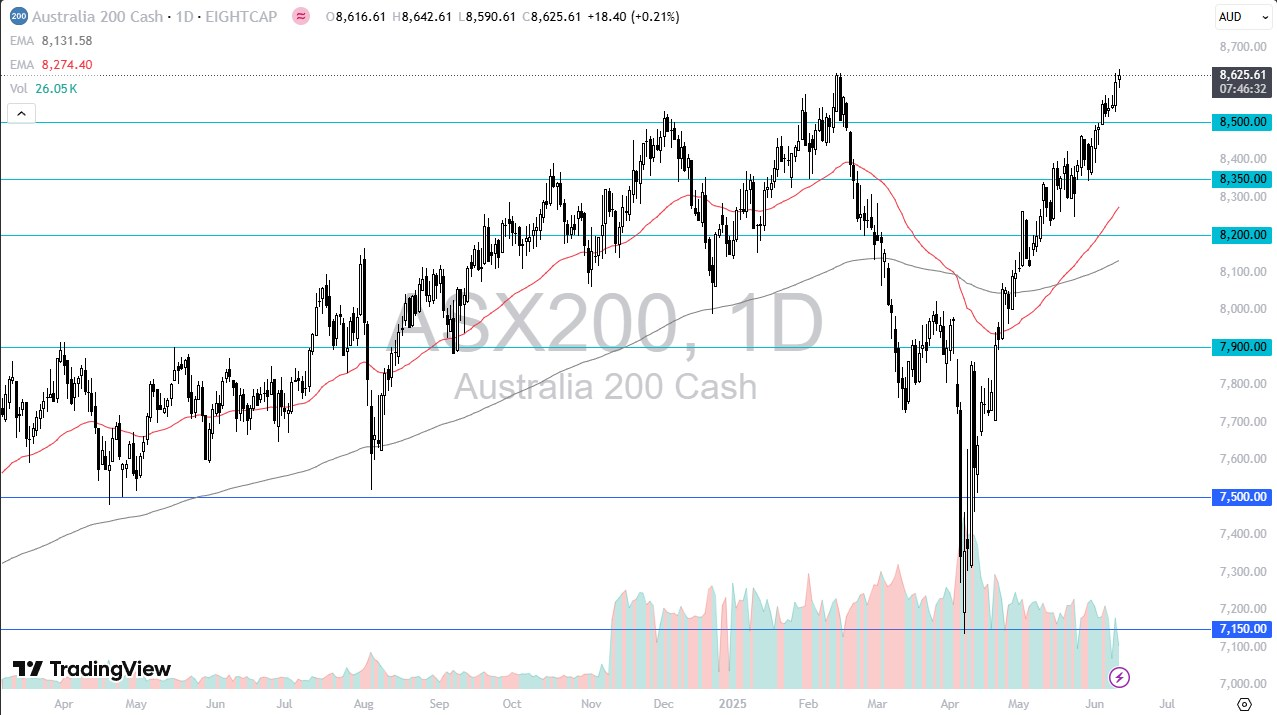
The ASX 200 extended its gains on Wednesday, continuing its rally in line with broader global indices. Overall, the market appears to be in a “buy on the dip” phase. However, volatility could increase if headlines from the ongoing US–China trade talks intensify.
The United States and China resumed their trade talk in London early this week. According to Donald Trump, both sides have reached an agreement that only requires signatures from President Xi and himself to be finalised. Trade talks between the US and China have reportedly yielded a preliminary agreement—China may boost rare earth exports, while the US considers easing student visa restrictions.
If a trade agreement is reached, Australia stands to benefit significantly—particularly through its export relationship with China, which is closely tied to Chinese exports to the United States. That said, given the strong rally in the ASX 200, a “sell the news” reaction in the short term cannot be ruled out.
However, the outlook remains positive for Australia’s export-driven sectors in the longer term.
Woolworths Group Limited (WOW)
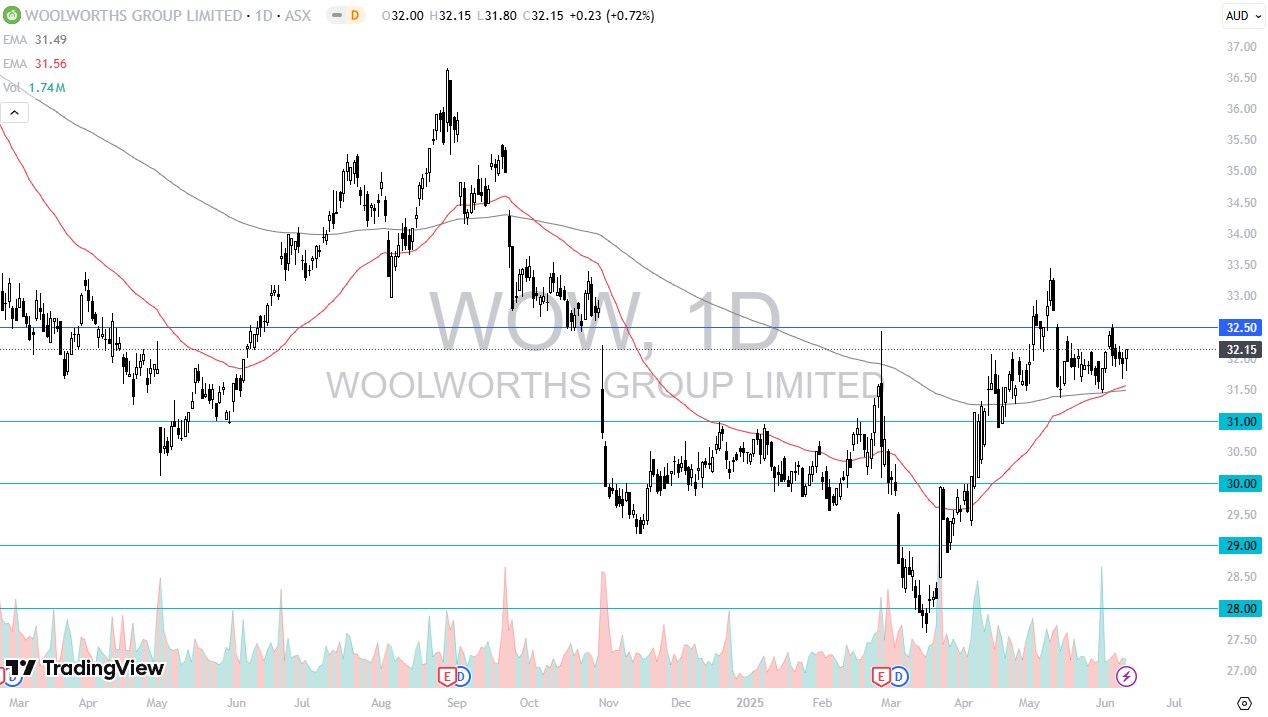
Woolworths Group rallied 0.72% as the consumer staples giant continues its upward move. Closing at the top of the daily range is a positive signal, especially following the appearance of the so-called “golden cross,” where the 50-day EMA crosses above the 200-day EMA.
Despite this bullish momentum, there is still notable resistance around the AU$32.50 level, leading to a period of consolidation. Over the past year, Woolworths (WOW) is down 0.74%, but recent price action suggests it is attempting to regain ground.
REA Group Limited (REA)
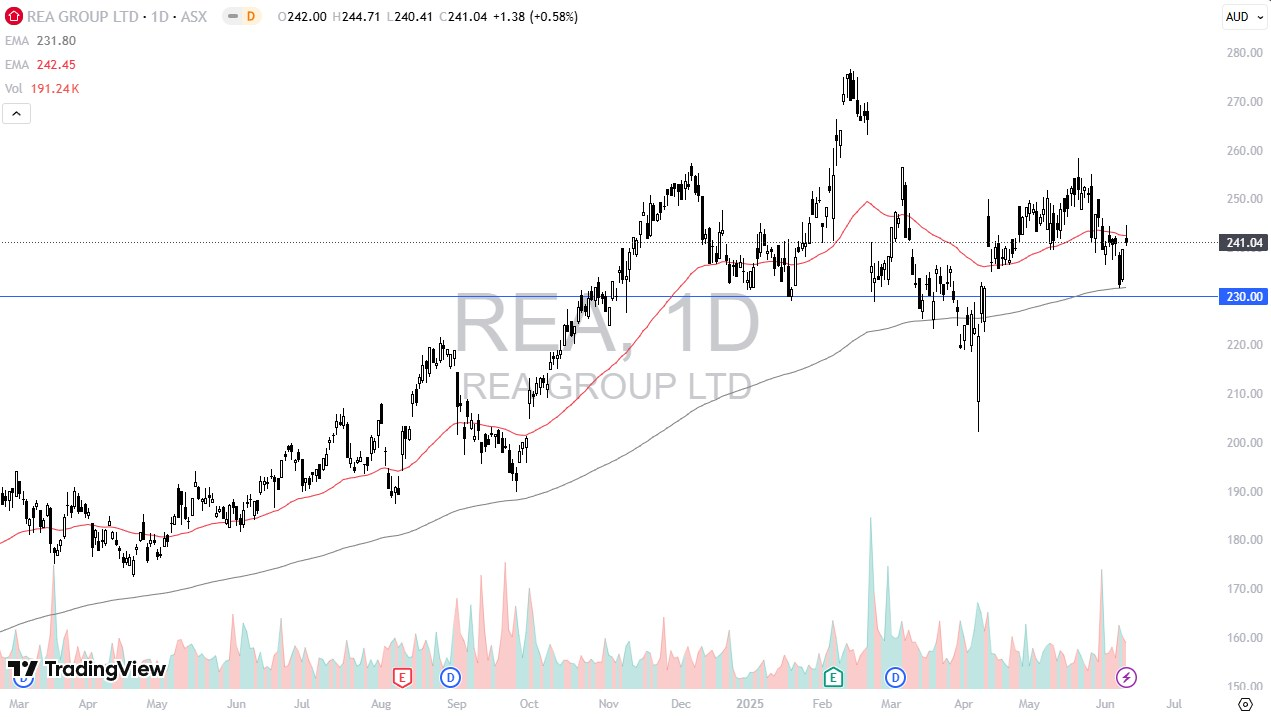
REA Group Limited gained 0.58% during Wednesday’s trading session, closing at AU$241.04. Over the past year, the stock has risen by 28.17%, although it has declined by 1.6% in the last month.
The session began on a stronger note, but resistance at the 50-day EMA reversed momentum, leading to a close near the session’s high and forming a potential shooting star pattern. Investor sentiment remains cautious as the market awaits the outcome of a probe launched by Australia’s competition regulator—an event likely to continue weighing on the stock.
QBE Insurance Group (QBE)
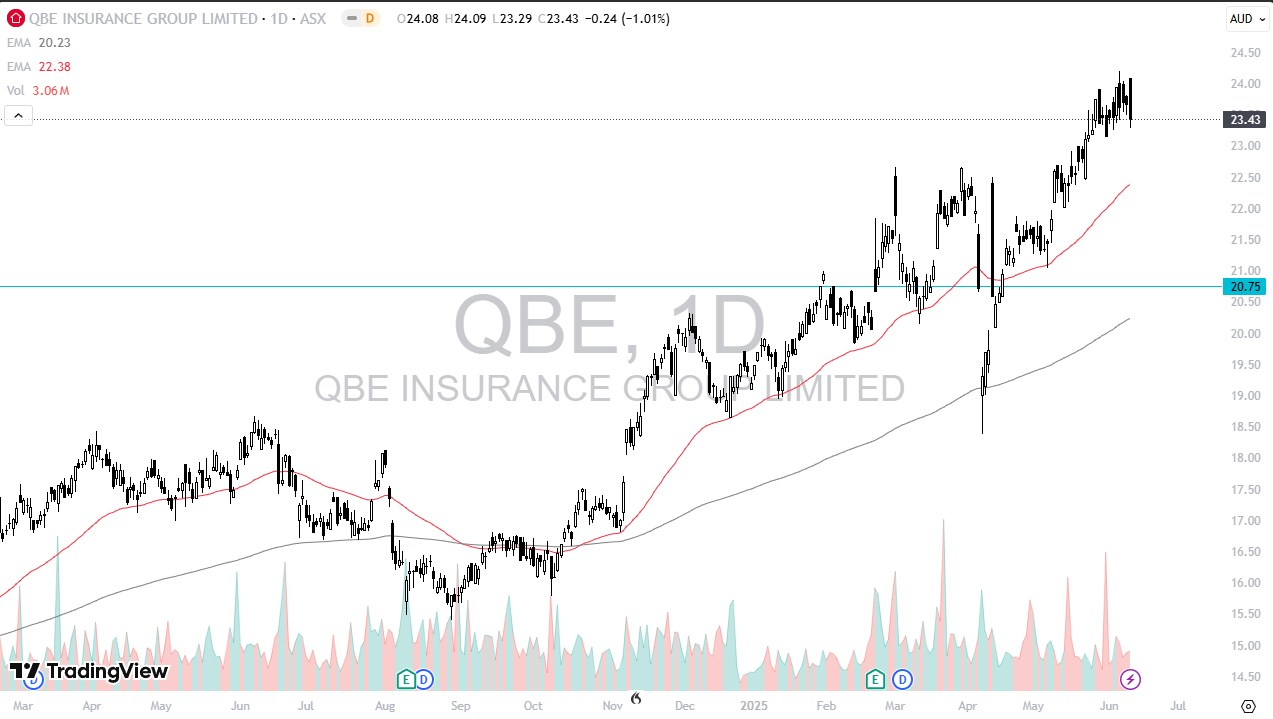
QBE Insurance Group fell 1.01% on Wednesday, though the financial giant remains firmly in a bullish trend. Over the past year, QBE has gained 27.61%, including a 3.72% rise over the last month.
The stock closed at AU$23.43, near the lower boundary of a recent consolidation zone, following a strong upward move. After such a sharp rally, it is likely the market may take a short-term pause or “breather.”
Despite the dip, the long-term uptrend remains intact, supported by the AU$0.63 dividend, which continues to appeal to longer-term investors. A period of consolidation to absorb recent gains would be considered a healthy market development.
Disclaimer: The material provided here has not been prepared in accordance with legal requirements designed to promote the independence of investment research and as such is considered to be a marketing communication. Whilst it is not subject to any prohibition on dealing ahead of the dissemination of investment research we will not seek to take any advantage before providing it to our client. No representation or warranty is given as to the accuracy or completeness of this information and therefore it shouldn’t be relied upon as such. Any research provided does not have regard to specific financial situations, needs or investment objectives. Vantage accepts no responsibility for any use that may be made of these comments and for any consequences that result. Consequently, any person acting on it does so entirely at their own risk. We advise any readers of this material to seek professional advice where necessary. Without the approval of Vantage, reproduction or redistribution of this information isn’t permitted.
-

Open Trading Account
Discover the endless trading possibilities with our cutting-edge platform, designed to empower our traders. Practice trading the markets with a free demo account today.
-

Download Vantage App
Trade on the go with the Vantage All-In-One Trading App, where smooth execution and market access come together in the palm of your hand.
-

Start Trading
Are you an existing user? Login to your account to start trading 1,000+ CFD products including forex, indices, gold, shares and more.
