
 Register
 Login
 Register





ASX 200 Continues to Threaten a Breakout

Christopher Lewis >
Market Analyst
Christopher Lewis >
Market Analyst
 Updated Wed, 2024 September 18 02:18

- Traders continue to watch New York and London.
- Three central banks (Federal Reserve, Bank of England, and the Bank of Japan) have interest rate decisions this week.
- Broad support for the market seen as of now.
The Monday session has been somewhat quiet for the ASX 200, gaining just a little over 25 basis points, suggesting that we are getting close to breaking above the crucial AU$8150 level. If and when we do, it would be a fresh, new, major high, and perhaps a breakout that could bring in a certain amount of “FOMO trading.” For what it is worth, the American indices look very much the same, and this of course can have a bit of a knock on effect in Australia.
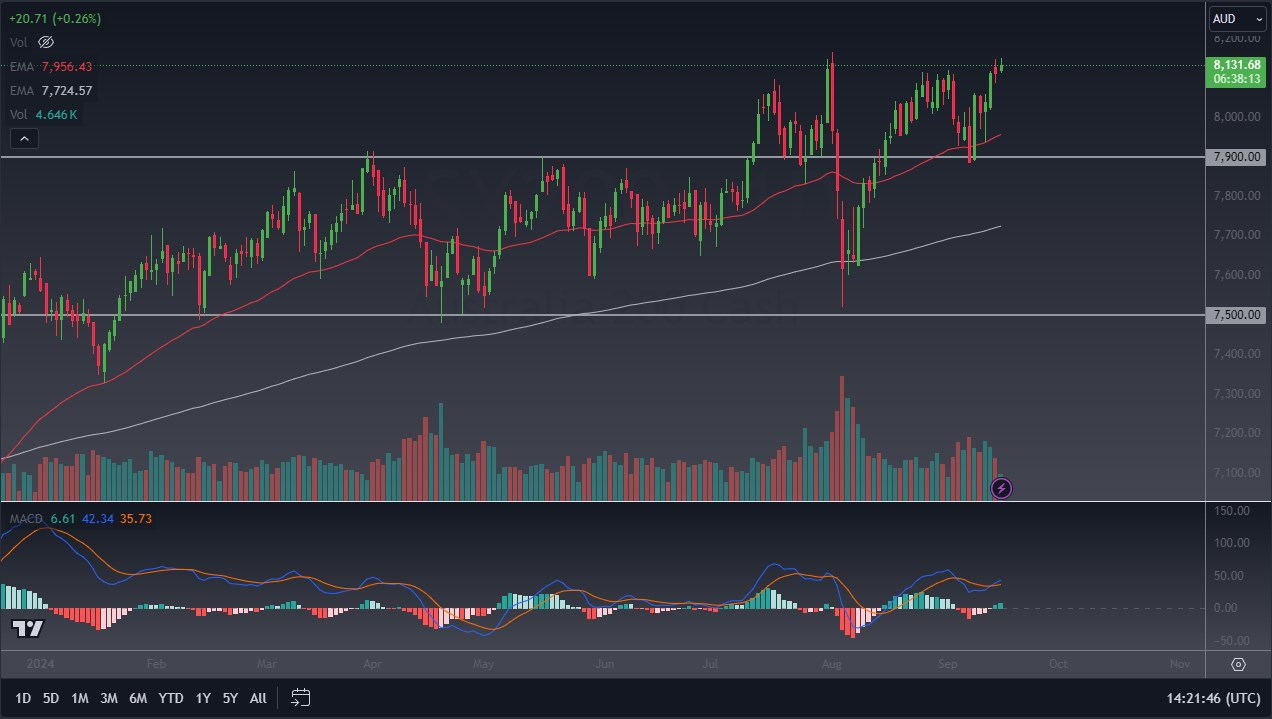
Risk appetite has been all over the place over the last couple of weeks, and it should be noted that the ASX 200 is considered to be a minor index, so as a general rule, it will take its cues from other parts of the world, especially New York and London. This will more likely than not continue to be the case, and with three central banks around the world meeting this week, volatility is probably going to be expected.
RIO Tinto (RIO)
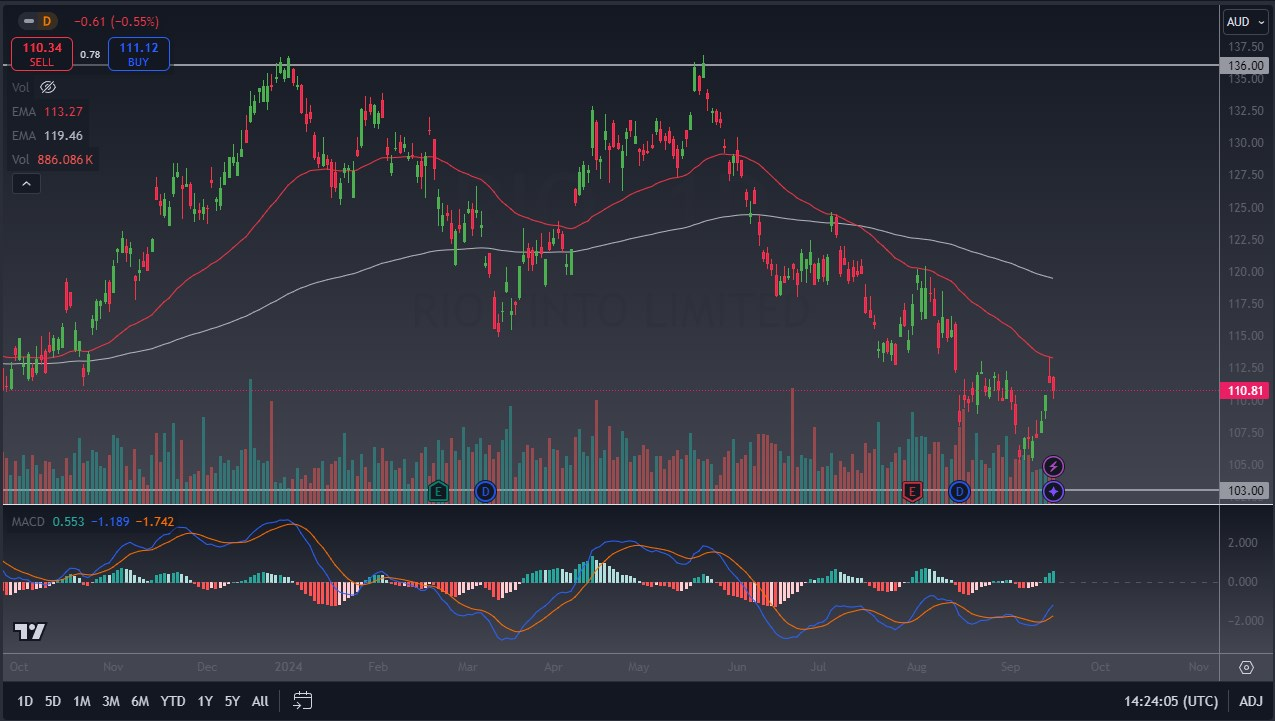
Rio Tinto continues to be very noisy, and it’s worth noting that the market touched the 50 Day EMA on Friday, after gapping higher. Monday session has seen the stock fill the gap and turned around to show signs of support. It’s also worth noting that the MACD is crossing over from a very low level, so it’s possible that technical traders could be looking at the 50 Day EMA as a major resistance barrier. Suggesting that a move above the AU$114 level could perhaps entice more traders to come into the marketplace.
Westpac Banking Corporation (WBC)
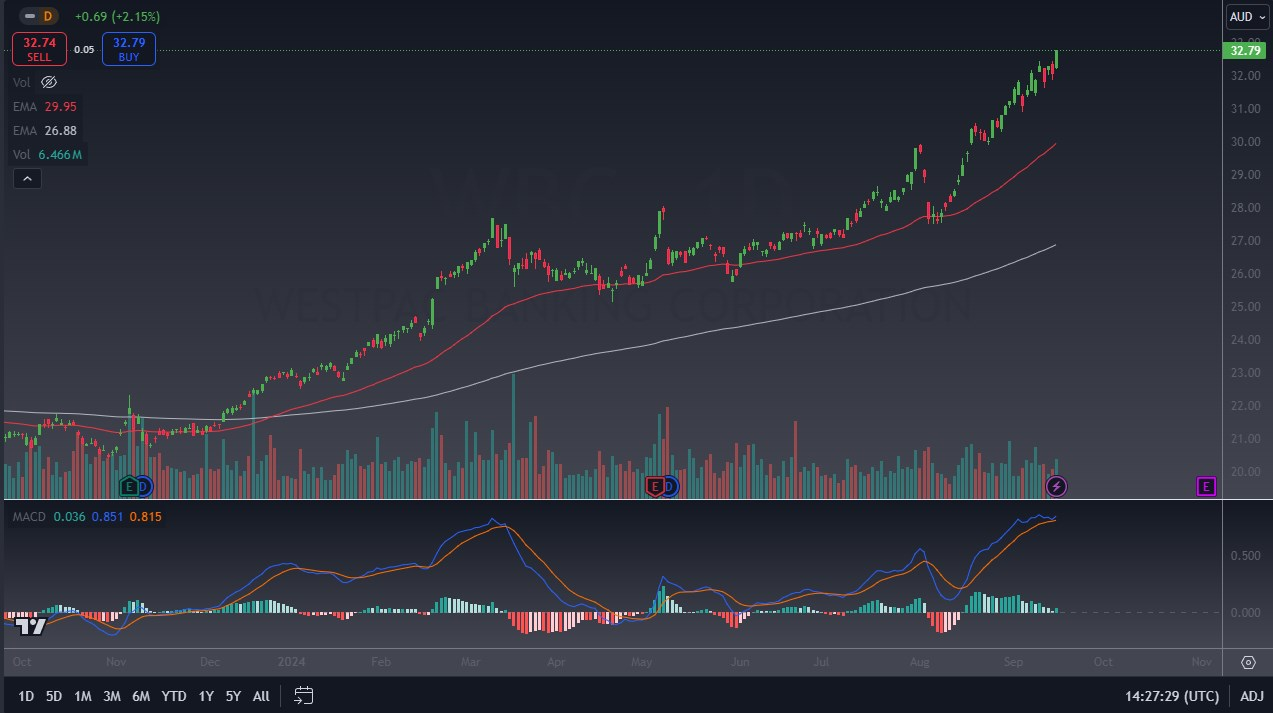
Westpac Banking Corporation continues to flex its muscles, breaking well above the AU$32.50 level during the Monday trading session, and gaining over 2%. This stock has recently broken out, and it is showing no real signs of pulling back quite yet. The moving averages on the MACD are quite crossing yet, although it’s probably worth noting that they are a little extended. Regardless, it is very likely that there will be traders out there looking at this as an opportunity they wish to take advantage of, especially if the interest rates continue to make the idea of loans more palatable for the Australian general public. Beyond that, central banks easy monetary policy can at times stoke risk appetite due to the idea that major construction projects are more likely to be taken on.
Telstra Group Ltd (TLS)
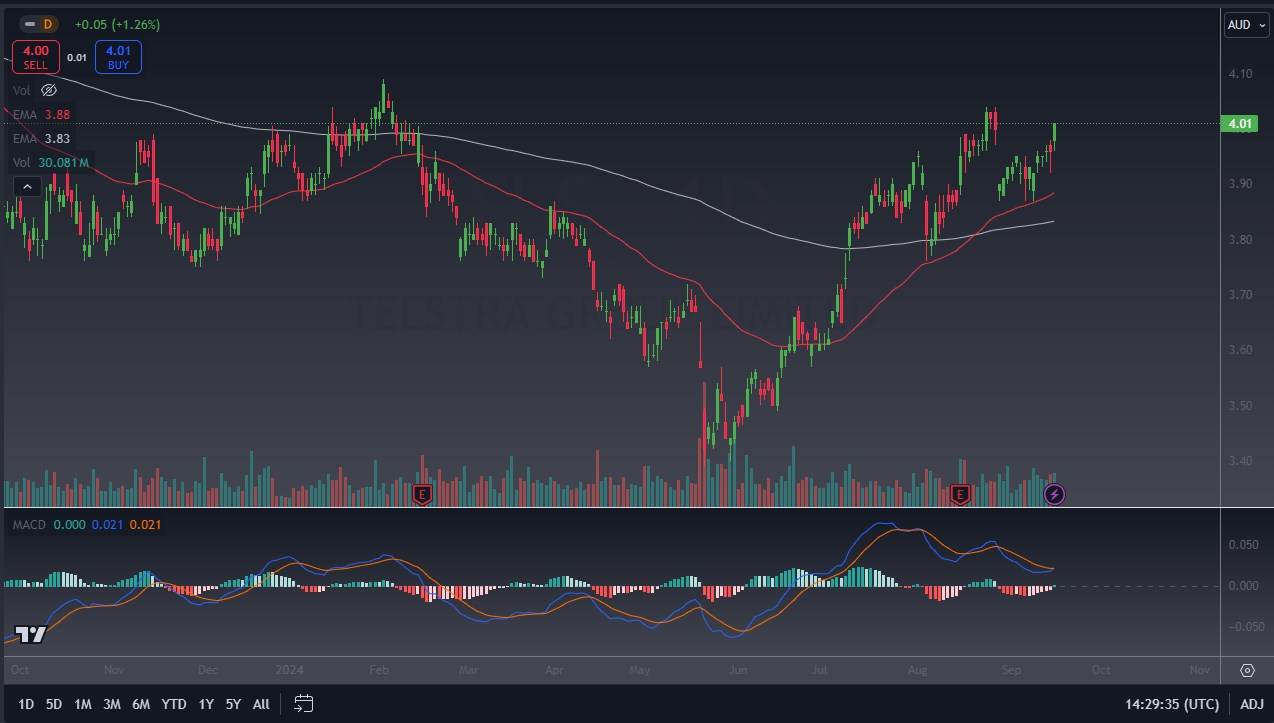
Telstra, the communication services giant in Australia, has gained 1.26% on Monday, as it continues to see quite a bit of a “buy on the dip” attitude. It is worth noting that we have now filled most of the gap from a couple of weeks ago, and as the stock is currently hanging around the AU$4.00 level, there could be a bit of psychology coming into the picture as well. That being said, it’s probably also worth noting that the moving averages on the MACD are starting to cross again, after dipping, which is also a positive technical signal. Looking at the longer-term charts, it’s apparent that the AU$4.10 level has been resistance in the past, so a break above that level could bring in fresh buying.
Disclaimer: The material provided here has not been prepared in accordance with legal requirements designed to promote the independence of investment research and as such is considered to be a marketing communication. Whilst it is not subject to any prohibition on dealing ahead of the dissemination of investment research we will not seek to take any advantage before providing it to our client. No representation or warranty is given as to the accuracy or completeness of this information and therefore it shouldn’t be relied upon as such. Any research provided does not have regard to specific financial situations, needs or investment objectives. Vantage accepts no responsibility for any use that may be made of these comments and for any consequences that result. Consequently, any person acting on it does so entirely at their own risk. We advise any readers of this material to seek professional advice where necessary. Without the approval of Vantage, reproduction or redistribution of this information isn’t permitted.
-

Open Trading Account
Discover the endless trading possibilities with our cutting-edge platform, designed to empower our traders. Practice trading the markets with a free demo account today.
-

Download Vantage App
Trade on the go with the Vantage All-In-One Trading App, where smooth execution and market access come together in the palm of your hand.
-

Start Trading
Are you an existing user? Login to your account to start trading 1,000+ CFD products including forex, indices, gold, shares and more.
