
 Register
 Login
 Register





ASX 200 Continues to See Upward Pressure

Christopher Lewis >
Market Analyst
Christopher Lewis >
Market Analyst
 Updated Tue, 2024 May 28 05:59

- ASX 200 rallies to start the week.
- The materials sector could be a big beneficiary.
- Mixed results in materials on Monday may be corrected after the European performance of copper and gold.
- America was on holiday, so the Tuesday session could be pivotal.
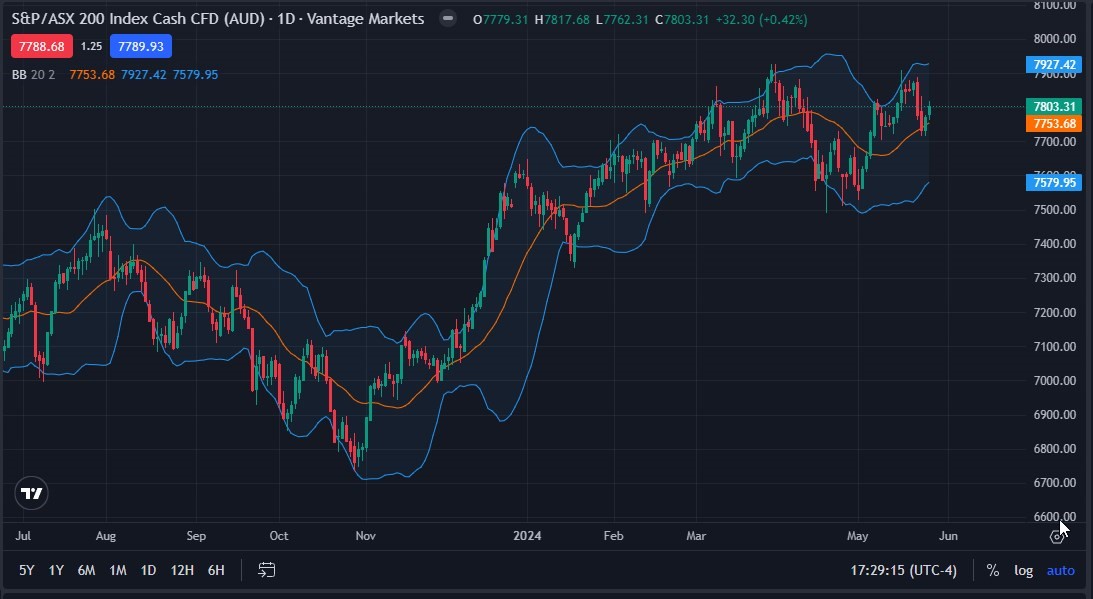
The Australian index continues to see a lot of upward pressure, as there are multiple things perhaps pushing money into the commodity markets. This of course is a major influence on where the ASX 200 ends up, but there are also technical factors at play as well.
The Technical Analysis
The technical analysis for the ASX 200 is rather positive, with the 20 EMA on the daily chart offering support over the last couple of sessions. The Bollinger Bands have a steady separation from that moving average, and the moving average points higher at a very sustainable angle at the moment. The ASX 200 is currently at the AU$7800 level, and it looks like it is trying to make it to the AU$7900 level. This is an area that recently have seen quite a bit of resistance and in fact is also at the top of the Bollinger Band region, so technical traders will more likely than not pay close attention.
Gold
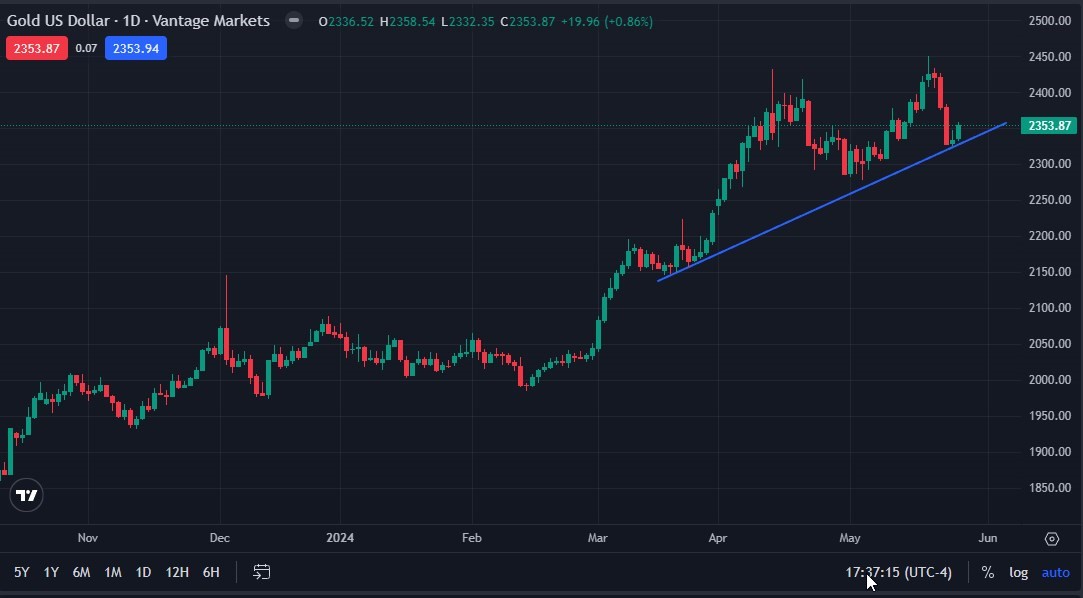
Gold of course continues to find buyers despite the fact that last week had seen quite a bit of selling. At this point, the market is likely to go looking toward the $2400 level of it continues to see any buying pressure, and it’s probably worth noting that a sizable trend line was just tested, while the Monday candlestick broke above a significant “inverted hammer” that was formed on Friday. These are typically bullish signs, and as long as traders continue to find value in this market, it could very well drive not only gold higher, but the ASX 200 higher, especially when it comes to the miners.
Copper
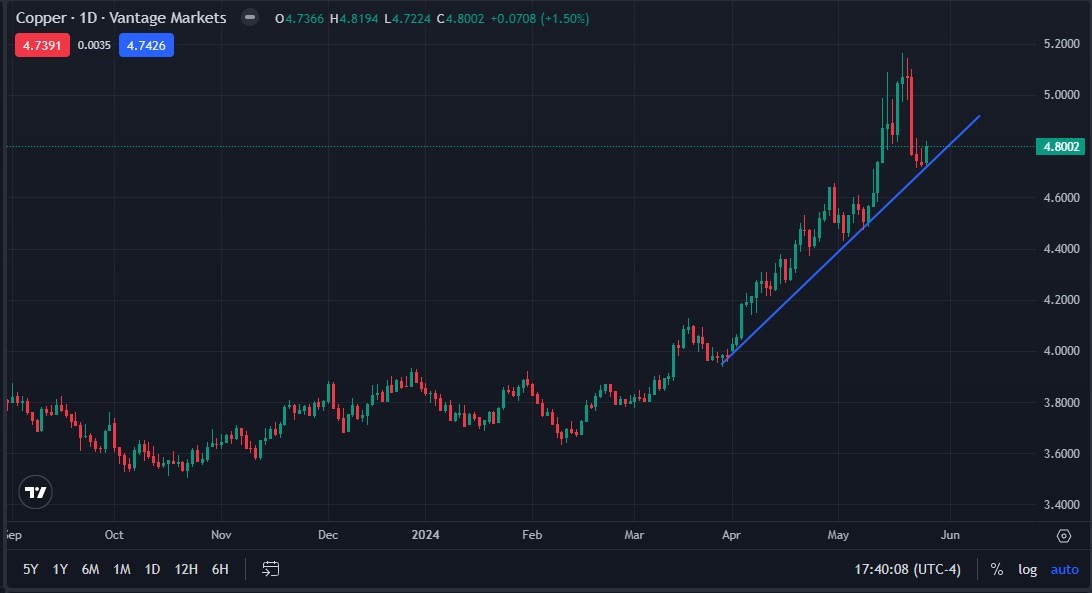
Copper rallied as well on Monday and is almost a mirror image of what is happening in the gold market. It is currently trading near the $4.80 level, breaking above the top of the Friday inverted hammer, and getting close to breaking above the top of the Thursday one from last week. This only adds more upward pressure on companies that focus on the materials sector in the ASX 200.
Continued Buying in Materials
On Monday, materials did quite well in Australia, with BHP gaining 1.14% during the session, while James Hardie Industries gain 32 basis points. It’s probably worth noting that there was a bit of a divergence as Rio Tinto dropped 61 basis points, while Fortesque lost 0.97%. That being said, most of the action in the futures markets for the hard material such as gold and copper happened during the European session, and of course traders will be keen to pay close attention to what the Americans do on Tuesday as it was Memorial Day in the United States.
If the typical correlation holds, the signs of life that we have seen in the so-called “hard commodities” could continue to put pressure to the upside in the materials sector in Australia. The Australian dollar strengthening recently has not been a major issue, mainly because it is that such a low base to begin with, trading around $0.61 to the US dollar.
Disclaimer: The material provided here has not been prepared in accordance with legal requirements designed to promote the independence of investment research and as such is considered to be a marketing communication. Whilst it is not subject to any prohibition on dealing ahead of the dissemination of investment research we will not seek to take any advantage before providing it to our client. No representation or warranty is given as to the accuracy or completeness of this information and therefore it shouldn’t be relied upon as such. Any research provided does not have regard to specific financial situations, needs or investment objectives. Vantage accepts no responsibility for any use that may be made of these comments and for any consequences that result. Consequently, any person acting on it does so entirely at their own risk. We advise any readers of this material to seek professional advice where necessary. Without the approval of Vantage, reproduction or redistribution of this information isn’t permitted.
-

Open Trading Account
Discover the endless trading possibilities with our cutting-edge platform, designed to empower our traders. Practice trading the markets with a free demo account today.
-

Download Vantage App
Trade on the go with the Vantage All-In-One Trading App, where smooth execution and market access come together in the palm of your hand.
-

Start Trading
Are you an existing user? Login to your account to start trading 1,000+ CFD products including forex, indices, gold, shares and more.
