
 Register
 Login
 Register





ASX 200 Continues to Range

Christopher Lewis >
Market Analyst
Christopher Lewis >
Market Analyst
 Updated Thu, 2024 October 24 06:16

- ASX 200 somewhat flat, despite several winners within.
- Lack of economic announcements may cause more of a drift higher.
- The recent winners continue to show strength.
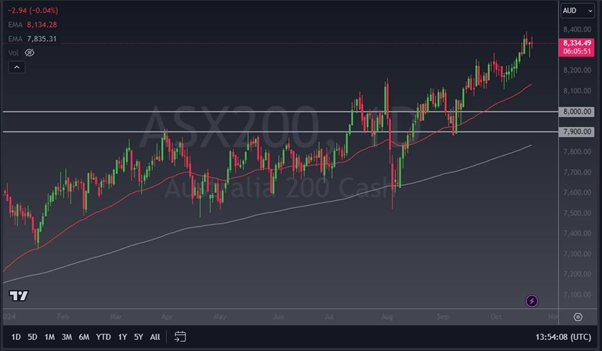
During the Monday session, we saw the ASX 200 range back and forth. Ultimately, this is a market that is trying to work off a lot of the excess upward momentum, as the market had recent bullish pressure that saw it break above the 8,300 level. All things being equal, this is a market that looks very much like one that’s positive, but also a little bit tired.
If the market does pull back from here, the reaction as of late has been one of value hunters jumping back in to pick it up again. The 50-Day EMA is currently near the AU$ 8150 level and is rising. This could give you an idea of bullish pressure, and the fact that the trend is very much intact. That being said, the Australian index has been very noisy as of late, so one would have to assume that will continue to be the case going forward.
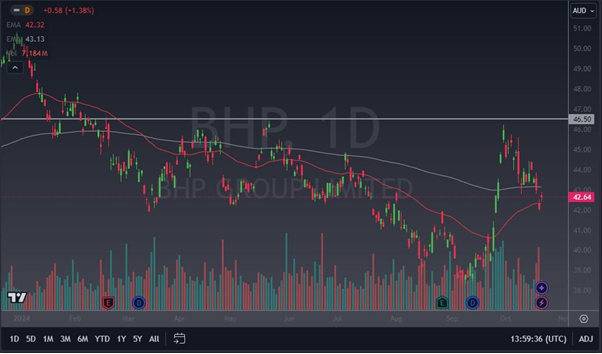
BHP Group (BHP)
BHP rallied 1.38% on Monday, as it continued its march higher. In the month of October, BHP Group has so far gained 5.70%, but over the course of the year, it has dropped 4.03%, as the materials giant continues to attract a lot of attention. It is worth noting that the market is currently challenging the 200-day EMA, which of course is an indicator that a lot of people will pay close attention to. It is also worth noting that volume picked up on Friday, so it does suggest that there are a certain number of buyers out there who wish to get involved.
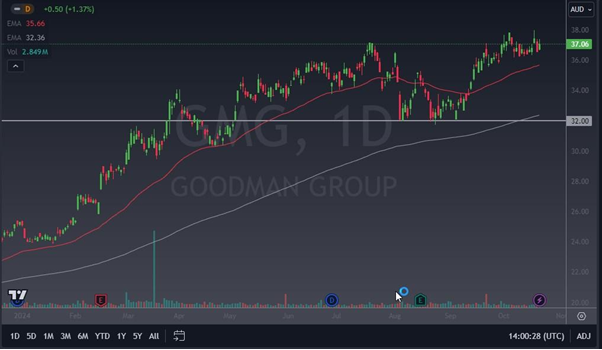
Goodman Group (GMG)
Goodman Group rallied Monday, gaining 1.37%. In fact, Goodman Group is up 75.64% over the last year, as the real estate giant continues to attract a lot of attention. For the last several weeks, it has gone sideways, suggesting that perhaps it is likely to continue digesting some of the gains, but it is clear that the AU$38 level has offered a significant amount of resistance. The 50-Day EMA sits just below the AU$36 level and is rising. All things being equal, this is the company that is currently working off some of that excess froth from the last several months and looks as if it is fairly stable from a volume perspective.
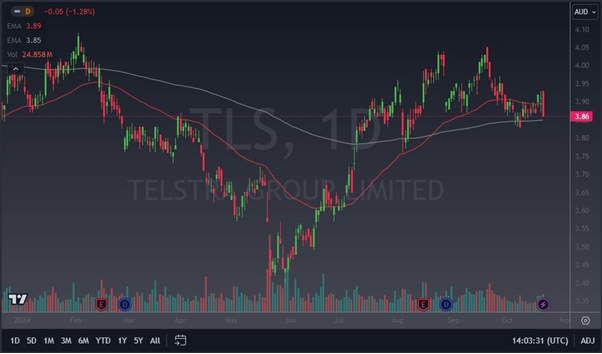
Telstra Group Ltd (TLS)
Telstra Group fell 1.28% on Monday, continuing to extend its loss for the month, currently down 2.77%. Over the last year, the communication giant has gained 1.31%. That being said, market participants look somewhat apathetic when it comes to this stock, but the 200-Day EMA sits underneath and offers support. The size of the candlestick on Monday does suggest that perhaps there is a bit of negativity, despite the fact that the Telstra CEO suggested that they continue to see earnings growth on Monday. At this point, it looks like a very confusing setup.
REA Group (REA)
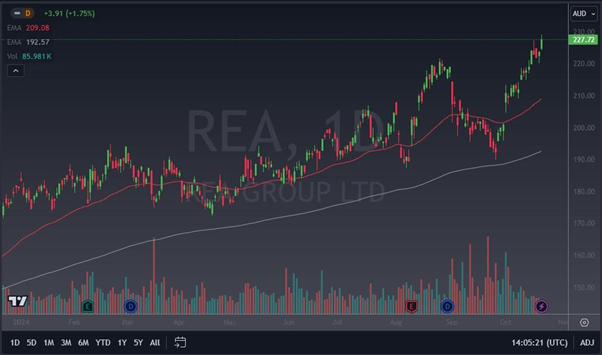
REA Group gained 1.75% on Monday, continuing the 14.44% gain that has been seen this month. After that, we then have to look at the one-year gain of 46.66% for the communication services giant. Furthermore, it’s worth noting that REA touched a fresh, high on Monday, so it does suggest that we are going to continue to see upward momentum, and it also appears that short-term pullbacks will continue to see a lot of buying interest in this stock has behaved like that for the last couple of weeks.
Disclaimer: The material provided here has not been prepared in accordance with legal requirements designed to promote the independence of investment research and as such is considered to be a marketing communication. Whilst it is not subject to any prohibition on dealing ahead of the dissemination of investment research we will not seek to take any advantage before providing it to our client. No representation or warranty is given as to the accuracy or completeness of this information and therefore it shouldn’t be relied upon as such. Any research provided does not have regard to specific financial situations, needs or investment objectives. Vantage accepts no responsibility for any use that may be made of these comments and for any consequences that result. Consequently, any person acting on it does so entirely at their own risk. We advise any readers of this material to seek professional advice where necessary. Without the approval of Vantage, reproduction or redistribution of this information isn’t permitted.
-

Open Trading Account
Discover the endless trading possibilities with our cutting-edge platform, designed to empower our traders. Practice trading the markets with a free demo account today.
-

Download Vantage App
Trade on the go with the Vantage All-In-One Trading App, where smooth execution and market access come together in the palm of your hand.
-

Start Trading
Are you an existing user? Login to your account to start trading 1,000+ CFD products including forex, indices, gold, shares and more.
