
 Register
 Login
 Register





ASX 200 Breaks Through Resistance

Christopher Lewis >
Market Analyst
Christopher Lewis >
Market Analyst
 Updated Thu, 2024 October 17 05:39

- ASX 200 was strong on Wednesday.
- A recovery of negativity globally on Wednesday.
- Aussie stocks attract inflows from global traders looking for momentum.
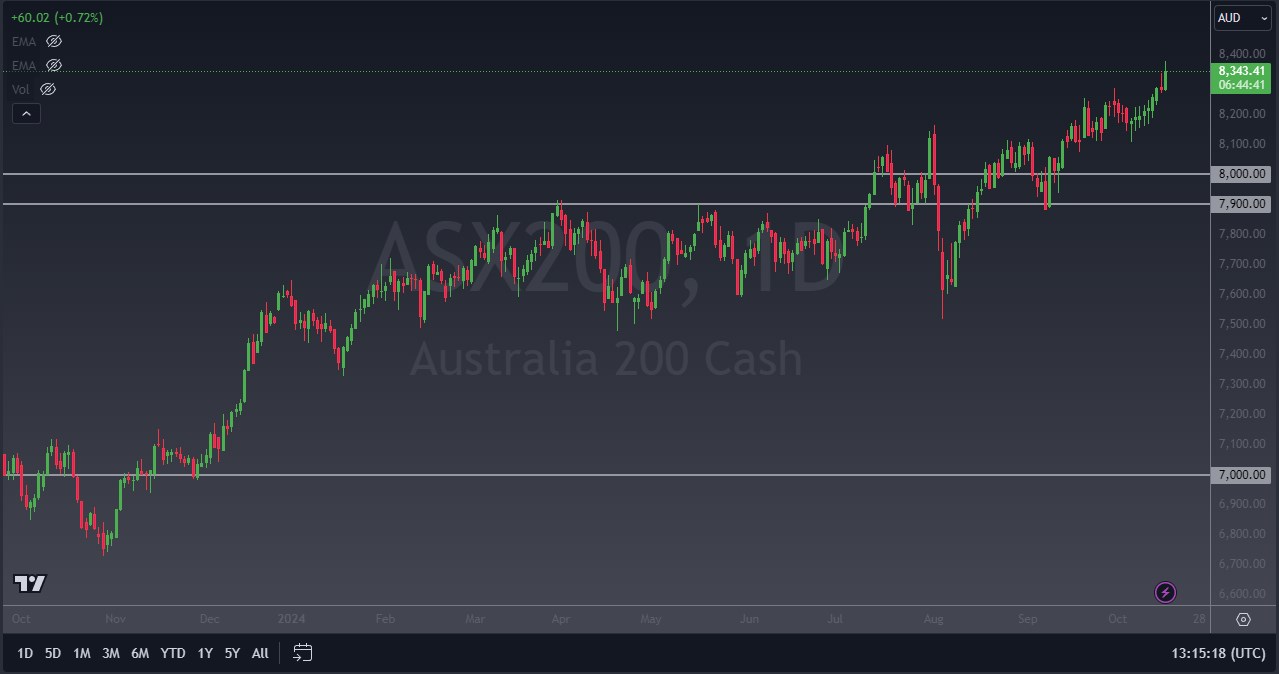
The ASX 200 broke higher during the early hours of Wednesday, breaking the back of a massive shooting star pattern from the Tuesday session in what is a fresh surge of bullish pressure. The market is looking at the 8400 level as a short term barrier, but it looks as if the fear that crept into the market on Tuesday has abated, not only in Australia but also other indices around the world.
Commonwealth Bank of Australia (CBA)
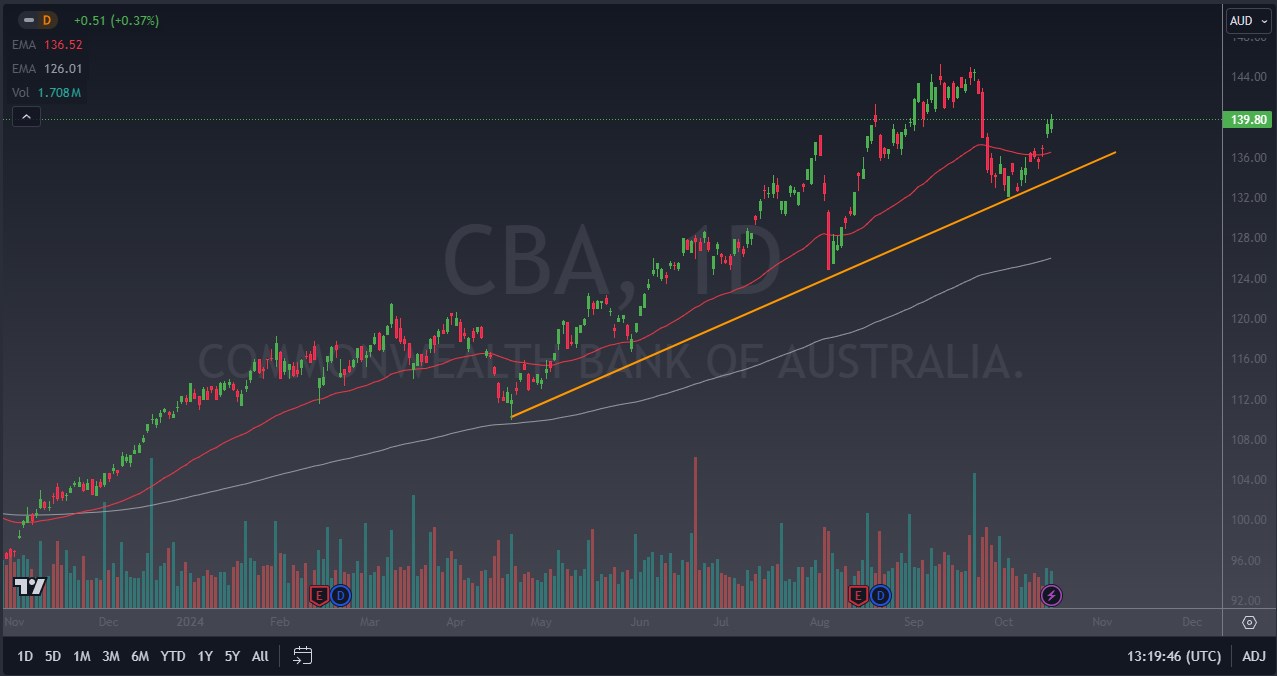
In the financial sector, the Commonwealth Bank of Australia rallied 0.37% for the trading session. This is a continuation of the recovery that the stock has been performing over the last month, which still has a return of -1.31%. However, it’s worth noting that over the last 12 months, CBA is up 38.14%. It is also worth noting that CBA’s CEO gave a rosy outlook during a speech given over the last 24 hours. Technical analysis also suggests that the uptrend may be getting ready to continue, as traders continue to eye the $145 level.
Woodside Energy Group Ltd (WDS)
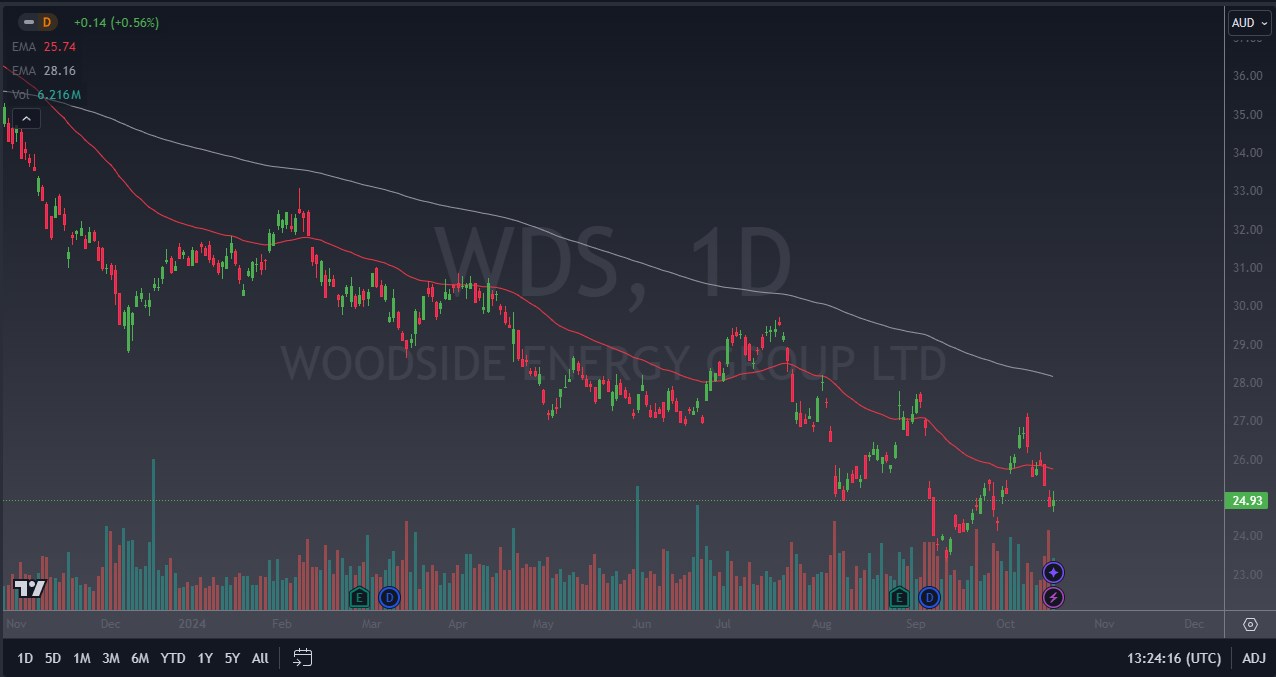
Woodside Energy Group rallied 0.57% for the Wednesday session, and over the last month has seen a gain of 2.80%. However, over the last year, WDS has lost a whopping 30.92%. Ultimately, this is a stock that has been in a downtrend for some time, and the fact that the market is currently dancing around $25 level probably captures a certain amount of attention. After the announcement that WDS sold more energy over the last couple of days, the market is starting to turn around and it is possible that technical analysts will look at this as a potential bottoming pattern as volume has picked up. While not a clear turn around quite yet, it’s obvious that this could be an area that traders will be watching, not only due to the technical analysis, but the possibility that more energy demand could very well mean a stronger economy in Australia.
Reece Ltd (REH)
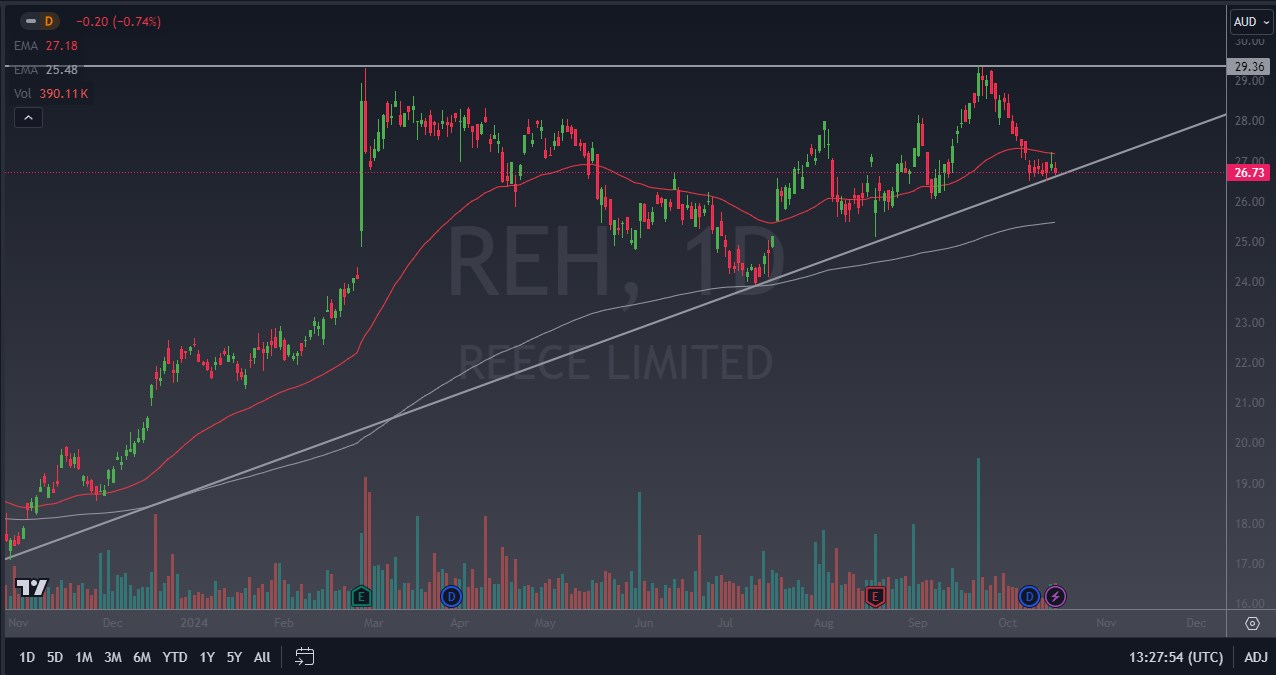
Reese struggled a bit during the trading session on Wednesday, as it dropped 74c. Reese also has been negative over the last month, dropping 3.71%. However, it’s worth noting that the industrial giant has gained 46.71% over the last 12 months, and it is also worth noting that the market has been in a slow and steady grind higher. At this point, the dividend REH is 0.177c, offering a little bit of a buffer along the way, something that traders have recently collected. At this point, the stock does look as if the industrial giant could continue to see momentum, but it’s also worth noting that the volume is relatively flat.
Evolution Mining Ltd (EVN)
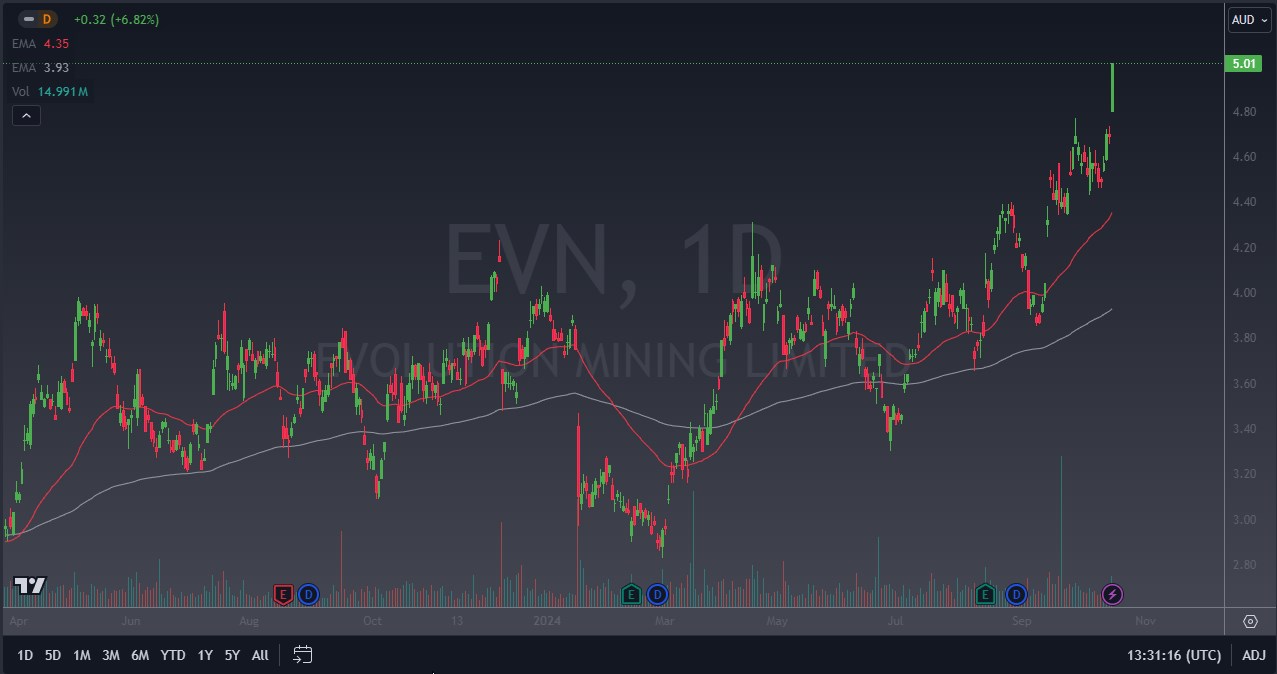
Evolution mining rallied rather significantly Wednesday, gaining 6.82% as it breaks about the $5 level. Evolution is up 15.97% over the last month, and 44.80% over the last 12 months as the materials company has found itself to be in the spotlight for massive surges of volume and bullish pressure. Evolution has announced that it has found more potential drilling sites to mine for gold, copper, and other hard materials. At this point, it looks like traders are trying to take advantage of extreme alpha.
Disclaimer: The material provided here has not been prepared in accordance with legal requirements designed to promote the independence of investment research and as such is considered to be a marketing communication. Whilst it is not subject to any prohibition on dealing ahead of the dissemination of investment research we will not seek to take any advantage before providing it to our client. No representation or warranty is given as to the accuracy or completeness of this information and therefore it shouldn’t be relied upon as such. Any research provided does not have regard to specific financial situations, needs or investment objectives. Vantage accepts no responsibility for any use that may be made of these comments and for any consequences that result. Consequently, any person acting on it does so entirely at their own risk. We advise any readers of this material to seek professional advice where necessary. Without the approval of Vantage, reproduction or redistribution of this information isn’t permitted.
-

Open Trading Account
Discover the endless trading possibilities with our cutting-edge platform, designed to empower our traders. Practice trading the markets with a free demo account today.
-

Download Vantage App
Trade on the go with the Vantage All-In-One Trading App, where smooth execution and market access come together in the palm of your hand.
-

Start Trading
Are you an existing user? Login to your account to start trading 1,000+ CFD products including forex, indices, gold, shares and more.
