
 Register
 Login
 Register





ASX 200 Bounces After Initial Fall on Wednesday

Christopher Lewis >
Market Analyst
Christopher Lewis >
Market Analyst
 Updated Thu, 2024 September 26 06:00

- ASX 200 continues to see overall sideways action.
- Other indices seem somewhat flat in general after a run higher.
- Very mixed returns in a number of Australian stocks.
- Some of the larger materials stocks seem to be attracting attention recently.
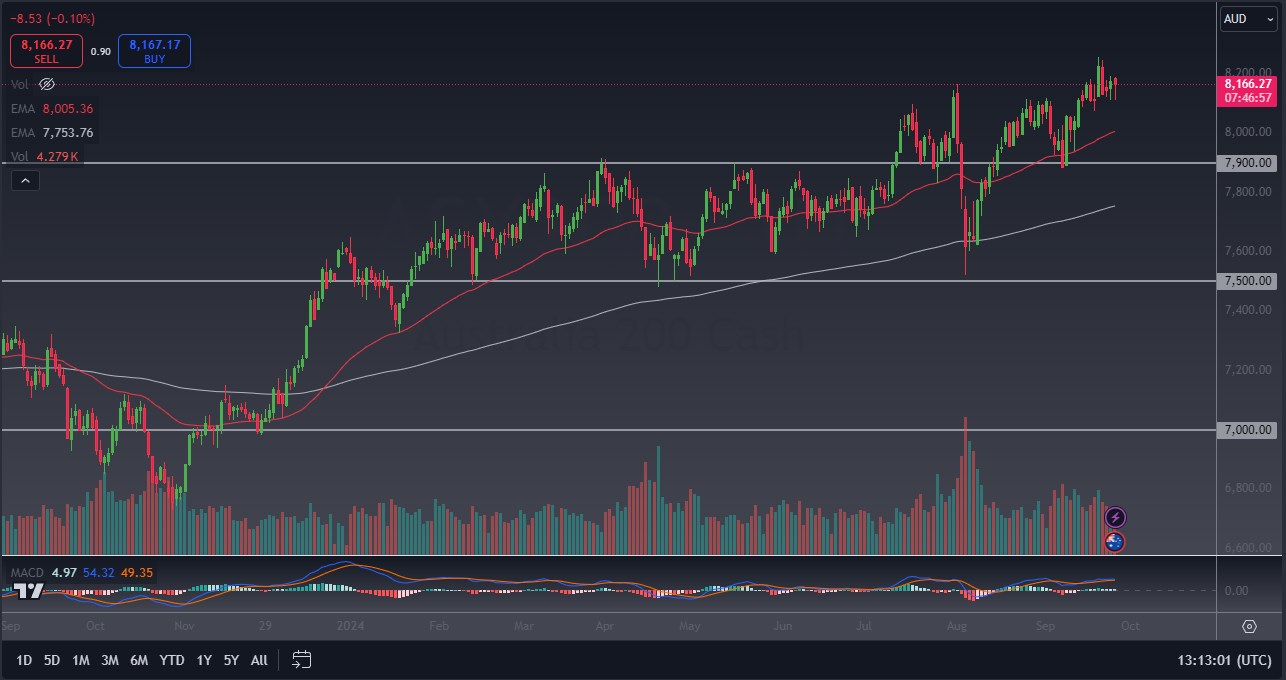
During the Wednesday session, we have seen the ASX 200 drop a bit, but we have seen a positive reaction to the AU$8100 level again, an area that has been important more than once. This is an area that has a certain amount of “market memory” attached to it, and of course it makes a certain amount of sense that technical traders have stepped in to support this market.
However, it’s probably worth noting that the ASX 200 has been somewhat sideways as of late, which makes a certain amount of sense considering that there are a lot of questions asked about the overall risk appetite of equity traders around the world, including of course, Australia.
CSL Ltd (CSL)
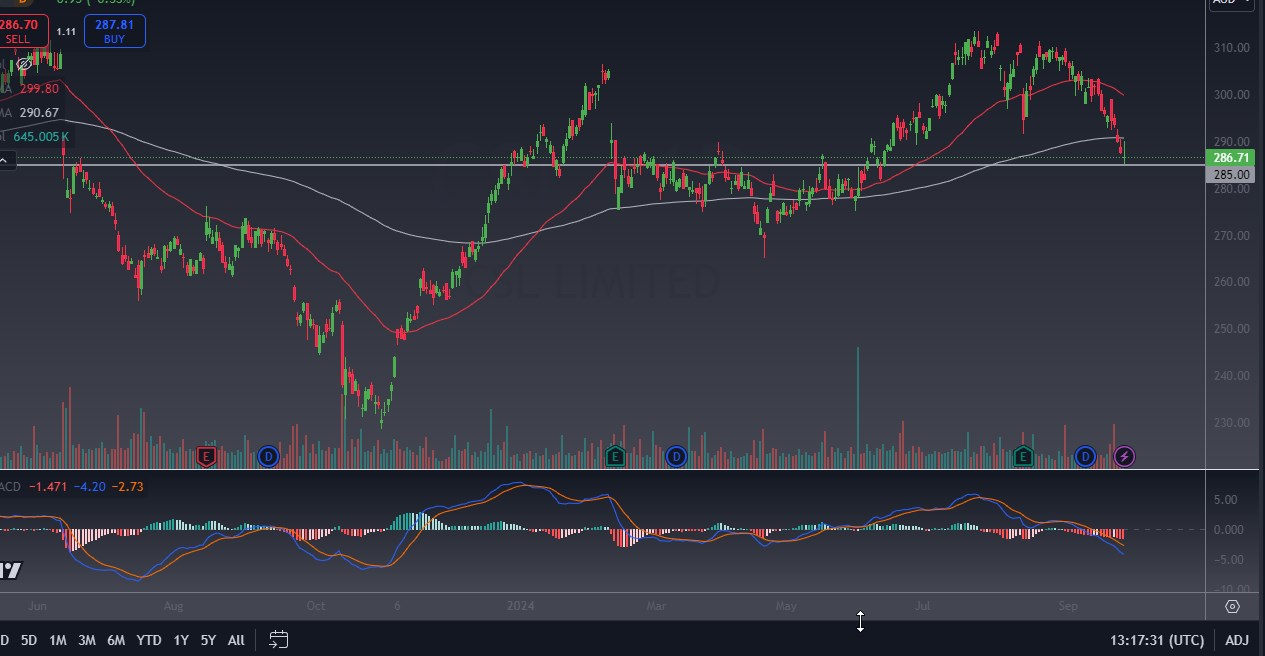
CSL fell 0.33% during the trading session on Wednesday, as the healthcare giant continues to struggle. The market has sent CSL below the 200 Day EMA, and even retested that massive technical indicator during the Wednesday session, only to see more sellers come into the market. It’s possible that the CSL shakeup in the C suite with the new Interim CFO being named could cause some concern, but the reality is that a healthcare stock typically performs fairly poor when risk appetite starts to pick up, so this could be a stock worth paying close attention to.
Fortescue Ltd (FMG)
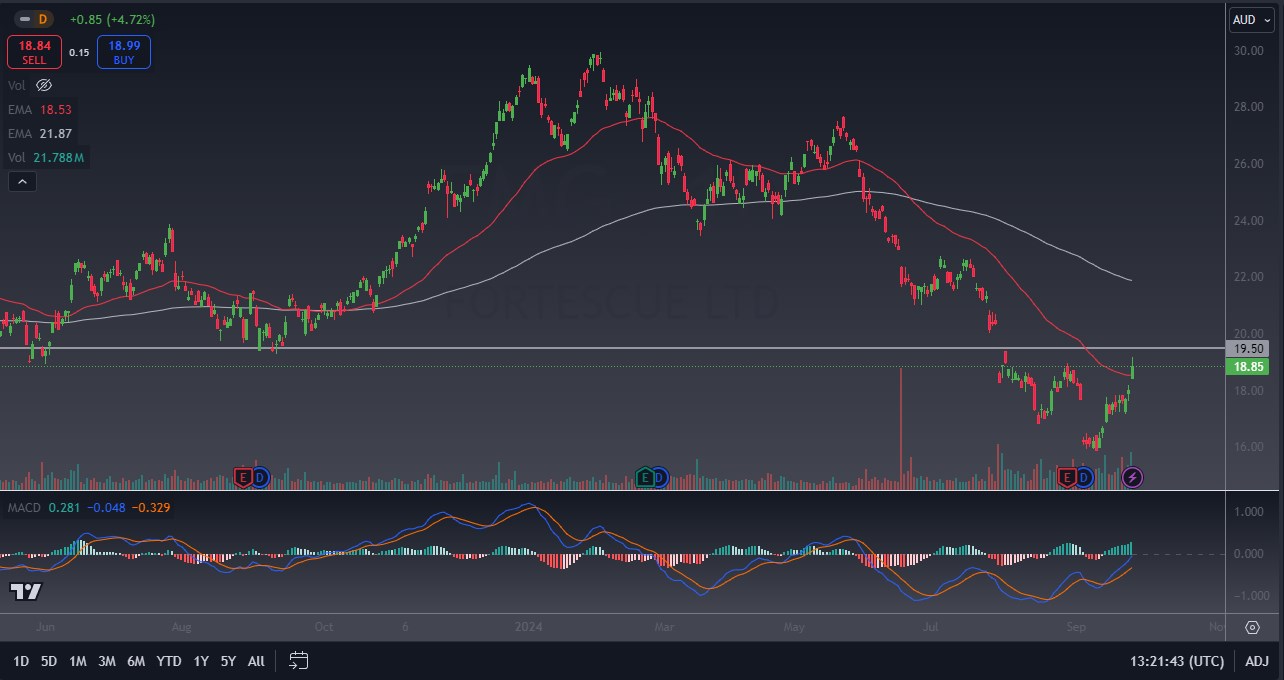
Fortescue has risen 4.72%, as the materials giant continues to rip to the upside. The last year has seen a drop of 6.27%, but with moves like these, it’s easy to see that this stock could end up wiping out all of the losses rather quickly. Looking at the chart, the AU$19.50 level begins a significant amount of resistance, but it is worth noting that FMG has broken above the 50 Day EMA, which of course is a victory for the bulls. It’s worth noting also that the volume has picked up as of late, so it does suggest that perhaps there is real demand behind FMG at this point.
REA Group (REA)
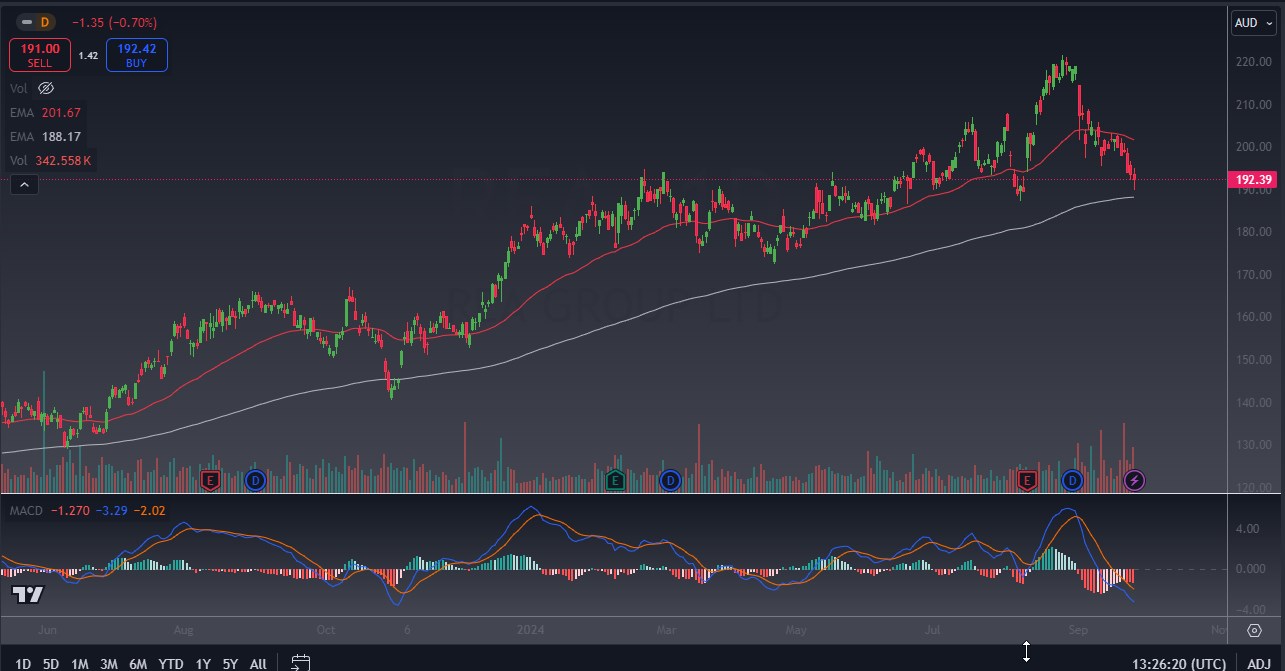
REA Group dropped 0.70% during the trading session on Wednesday, extending its decline over the last month to a loss of 11.08%. However, it’s also worth noting that the communication services giant is up 22.72% over the last 12 months, so these losses need to be taken into context. Furthermore, looking at the chart it’s obvious that we are in an area that could attract a certain amount of attention, mainly due to the fact that the 200 Day EMA sits just below the hammer like candlestick that formed for the Wednesday session, and could perhaps attract a certain amount of attention. The market has been in a nice uptrend for quite some time, so if the buyers jump back in, it could attract more attention by the bulls.
Woolworths Group Ltd (WOW)
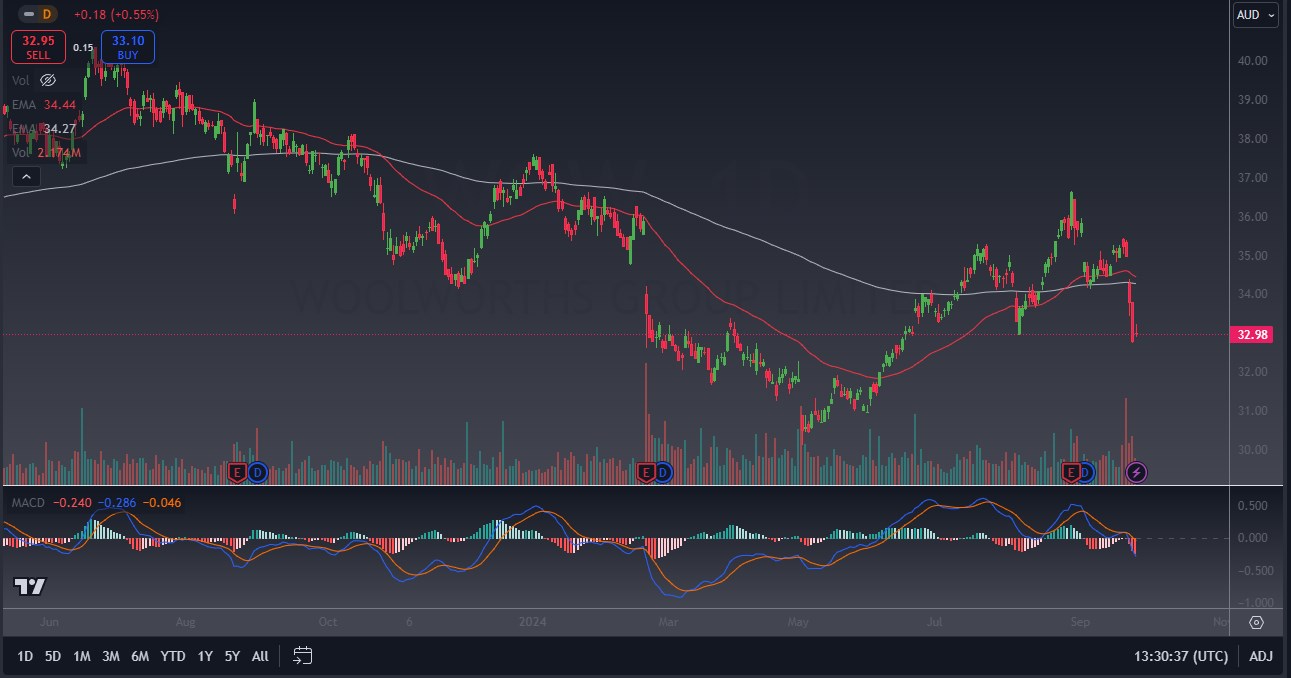
Woolworths has gained 0.55% for the trading session on Wednesday, as the consumer Staples giant continues to do everything it can to turn around what has been a rough stretch lately. Over the last 30 days, WOW has lost 8.16%, and over the last 12 months, it has dropped 12.22%. However, there has been historical interest near the AU$31 level, so the downside might be somewhat limited. It is also worth noting though, the market is well below the 200 Day EMA again, so technical traders will probably shun this stock until we see some type of significant bounce.
Disclaimer: The material provided here has not been prepared in accordance with legal requirements designed to promote the independence of investment research and as such is considered to be a marketing communication. Whilst it is not subject to any prohibition on dealing ahead of the dissemination of investment research we will not seek to take any advantage before providing it to our client. No representation or warranty is given as to the accuracy or completeness of this information and therefore it shouldn’t be relied upon as such. Any research provided does not have regard to specific financial situations, needs or investment objectives. Vantage accepts no responsibility for any use that may be made of these comments and for any consequences that result. Consequently, any person acting on it does so entirely at their own risk. We advise any readers of this material to seek professional advice where necessary. Without the approval of Vantage, reproduction or redistribution of this information isn’t permitted.
-

Open Trading Account
Discover the endless trading possibilities with our cutting-edge platform, designed to empower our traders. Practice trading the markets with a free demo account today.
-

Download Vantage App
Trade on the go with the Vantage All-In-One Trading App, where smooth execution and market access come together in the palm of your hand.
-

Start Trading
Are you an existing user? Login to your account to start trading 1,000+ CFD products including forex, indices, gold, shares and more.
