
 Register
 Login
 Register





Commodities in the Crosshairs – What’s next for Gold and Oil as US-China resume trade talks?

Jamie Dutta >
Market Analyst
Jamie Dutta >
Market Analyst
 Updated Tue, 2025 June 10 04:32

Markets have shifted their attention from job data to geopolitics, as high-stakes trade talks between the US and China resumed this week in London. The discussions are centred around easing tech export curbs and improving rare earth mineral flows, with both sides signalling a willingness to negotiate. This development has injected fresh volatility into global markets, especially in commodities, which are sensitive to geopolitical shifts.
Gold, a classic safe haven, continues to attract demand as traders hedge against macro headwinds and trade uncertainties. However, in the short term, improving risk sentiment with renewed optimism around the US-China talks has put some pressure on the yellow metal. Despite a slight retracement, the broader trend remains bullish, underpinned by structural demand and diversification away from US assets.
Oil, typically seen as a bellwether for global demand, fares better amid the improved risk sentiment. A resilient US labour market, as seen by May’s better-than-expected Non-Farm Payrolls data, has eased concerns about the US economy. This, coupled with progress on trade negotiations, has helped lift crude prices in the short term, though lingering concerns about global growth still weigh on the broader outlook.
XAUUSD – Continued Demand is Expected
Despite the slight dip in prices last week, gold still benefits from a structural shift away from US-denominated assets and central banks’ demand. Its safe-haven appeal remains strong, especially amid prolonged policy uncertainty and evolving trade dynamics.
Ticker: XAUUSD, Timeframe: Daily
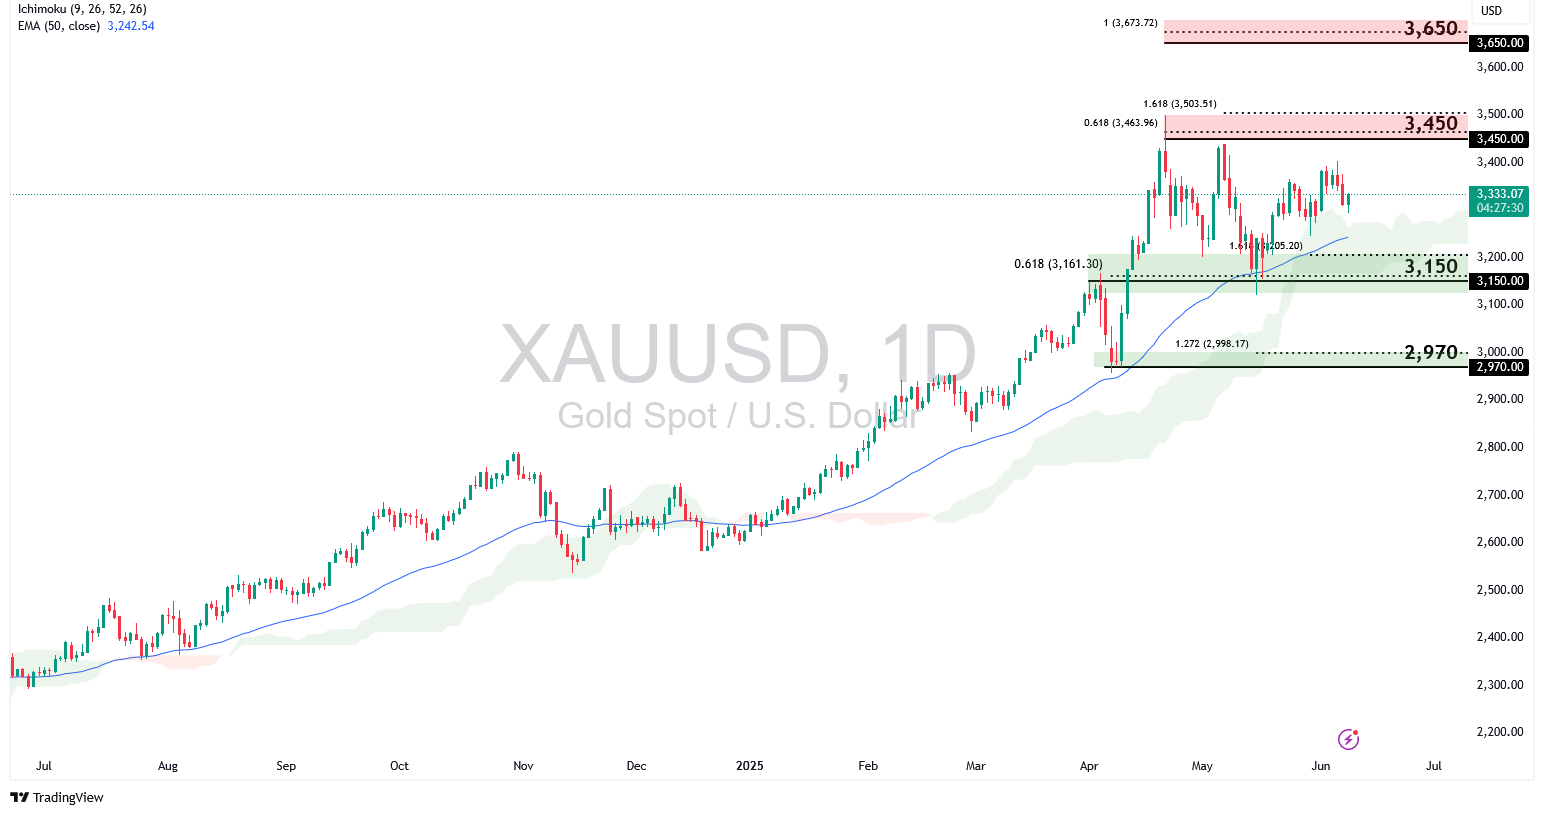
XAUUSD is still holding above both the Ichimoku cloud and 50-EMA, showing signs of bullish momentum. A continuation of this trend could see a retest of the $3,450 resistance zone, which aligns with the 61.8% and 161.8% Fibonacci Extension levels. A convincing break and close above $3,450 could see new highs being formed, potentially reaching the $3,650 level, in line with the 100% Fibonacci Extension level.
However, if XAUUSD retreats below the $3,450 resistance, we could see price retrace further, potentially retesting the $3,150 support zone, in line with the 61.8% Fibonacci Retracement and 161.8% Fibonacci Extension levels, or even towards the $2,970 swing low support, which is in line with the 127.2% Fibonacci Extension level.
Crude Oil – More is Needed to Assuage Market Fears
Crude oil found some support from upbeat U.S. labour market data, but with the outcome of US-China trade talks still uncertain and global demand concerns persisting, oil prices remain rangebound. Markets will need more clarity, likely in the second half of 2025, to fully assess the economic impact of tariffs and broader trade disruptions.
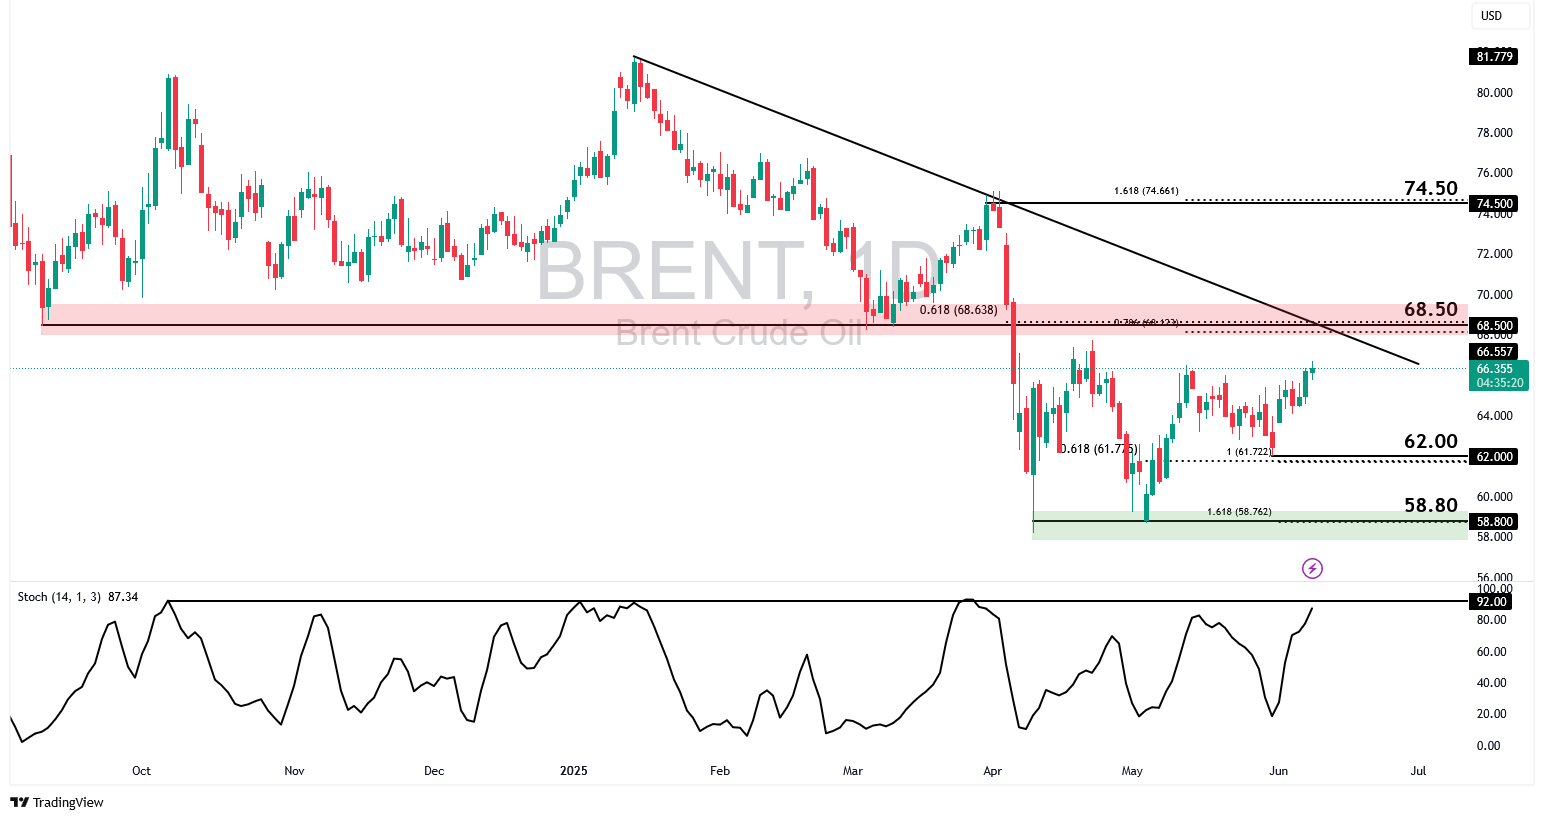
Technical suggest that BRENT remains vulnerable to the downside, with the Stochastic indicator approaching the 92 level, signalling that the price is near overbought levels. The price is also holding below a descending trendline.
A reversal and further decline from the $68.50 resistance zone, which is in line with the 61.8% Fibonacci Retracement and 78.6% Fibonacci Extension levels, could pave the way for a continuation of the bearish momentum, where the price is likely to test support levels at $62.00 and $58.80, which are both swing low supports.
Otherwise, a decisive break above $68.50 could prompt further gains toward the next swing high at $74.50, in line with the 161.8% Fibonacci Extension level.
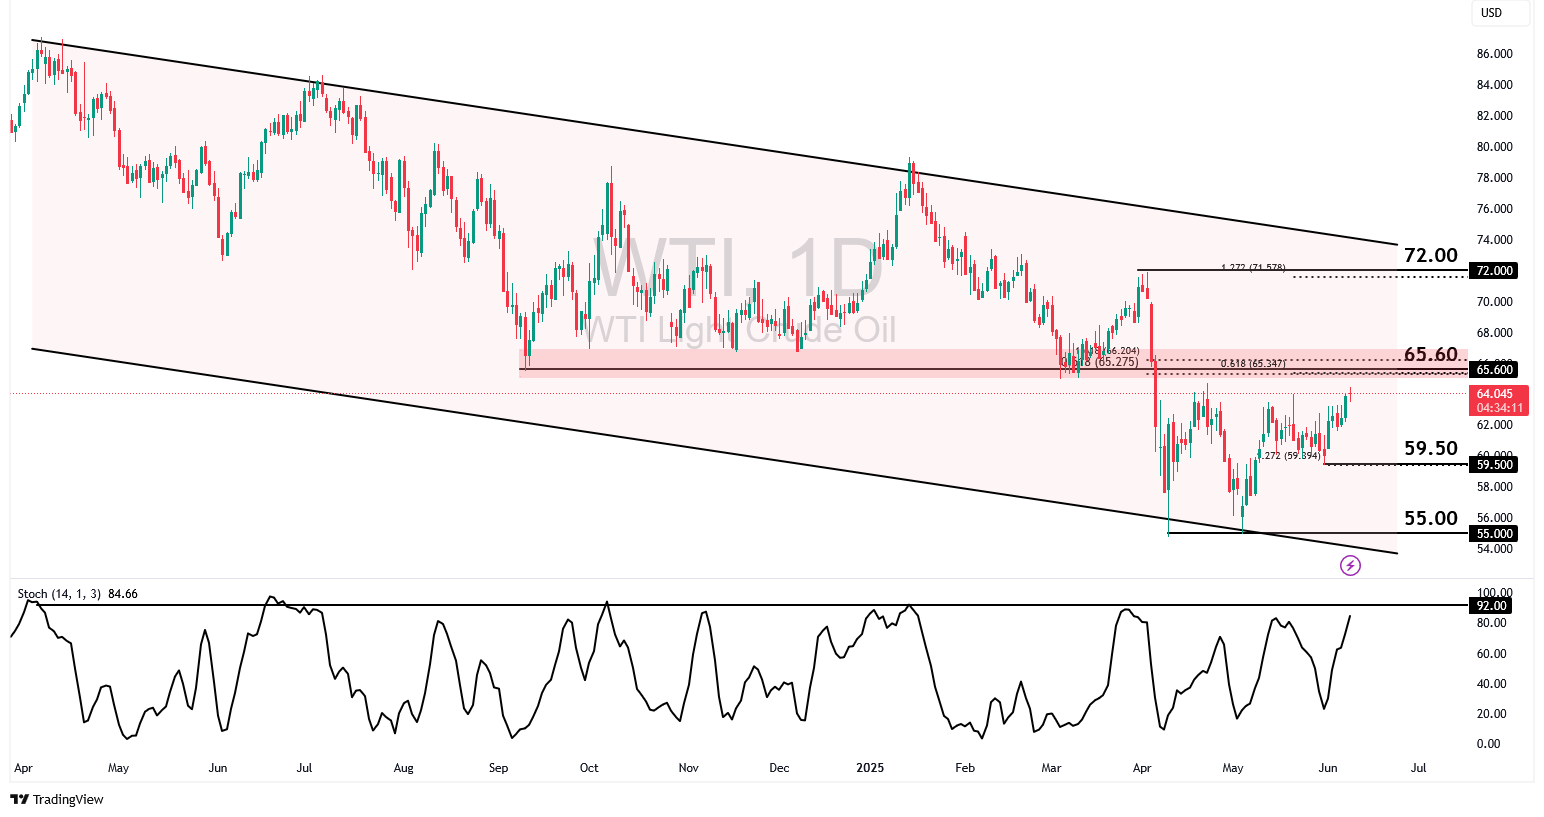
WTI is trading within a descending channel, with the price now approaching the key $65.60 resistance zone, an area of Fibonacci confluence, including the 61.8% Fibonacci Retracement level of the previous decline. The Stochastic indicator is also nearing an overbought territory, suggesting that recent bullish momentum may be fading.
A rejection below $65.50 could see the price retreat towards the $59.50 support, which aligns with the 127.2% Fibonacci Extension level, followed by the $55.00 swing low support.
However, a break and close above $65.60 would indicate a potential shift in sentiment, opening the door for a move toward the $72.00 resistance, in line with the next 127.2% Fibonacci Extension. This could signal a potential change in trend.
As oil and gold markets are at key points where a pivot is possible, it is important to keep a lookout for key data releases in the coming months. Labour market and inflation data could provide early signals on how the US and other countries are weathering the impact of tariffs and shifting trade dynamics, which will then have knock-on effects on both gold and crude oil prices.
Disclaimer: The material provided here has not been prepared in accordance with legal requirements designed to promote the independence of investment research and as such is considered to be a marketing communication. Whilst it is not subject to any prohibition on dealing ahead of the dissemination of investment research we will not seek to take any advantage before providing it to our client. No representation or warranty is given as to the accuracy or completeness of this information and therefore it shouldn’t be relied upon as such. Any research provided does not have regard to specific financial situations, needs or investment objectives. Vantage accepts no responsibility for any use that may be made of these comments and for any consequences that result. Consequently, any person acting on it does so entirely at their own risk. We advise any readers of this material to seek professional advice where necessary. Without the approval of Vantage, reproduction or redistribution of this information isn’t permitted.
-

Open Trading Account
Discover the endless trading possibilities with our cutting-edge platform, designed to empower our traders. Practice trading the markets with a free demo account today.
-

Download Vantage App
Trade on the go with the Vantage All-In-One Trading App, where smooth execution and market access come together in the palm of your hand.
-

Start Trading
Are you an existing user? Login to your account to start trading 1,000+ CFD products including forex, indices, gold, shares and more.
