
 Register
 Login
 Register





ASX 200 Retreats After Early Gains Amid Global Growth Concerns

Christopher Lewis >
Market Analyst
Christopher Lewis >
Market Analyst
 Updated Thu, 2025 July 3 09:06

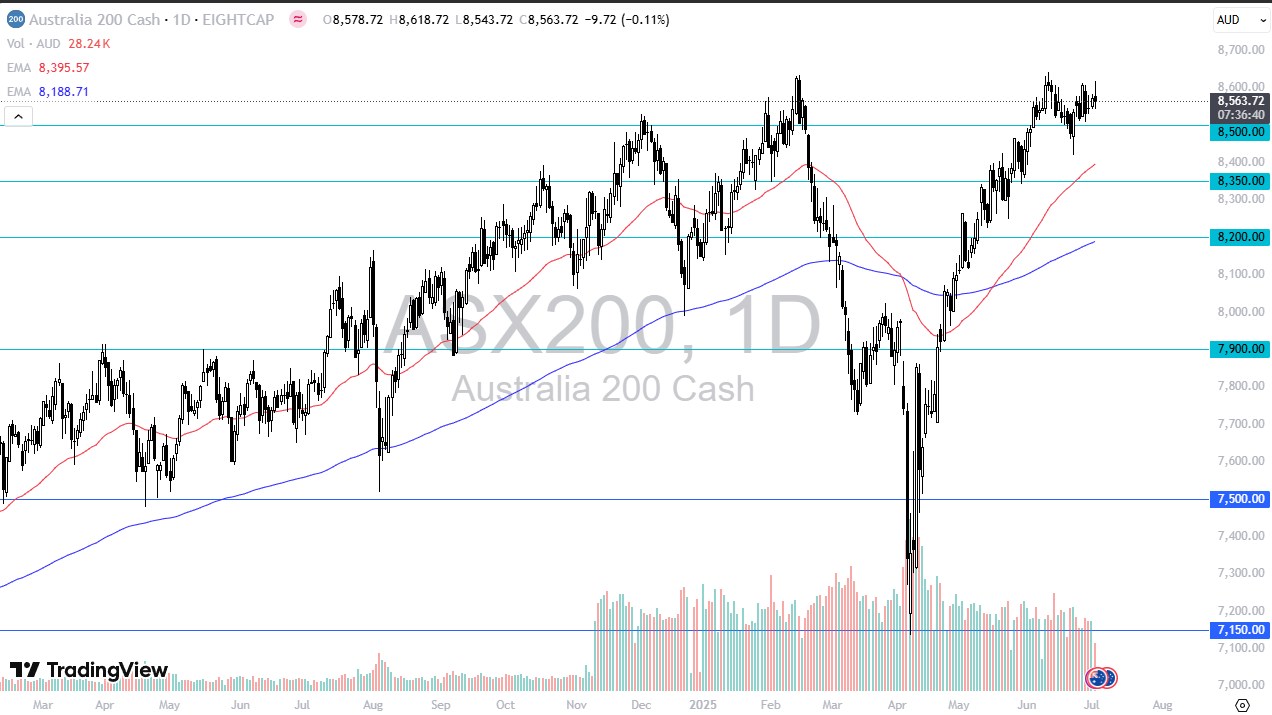
- ASX 200 fails to hold above AU$8600 as market sentiment shifts
- Growing concerns about the US economy and future Fed rate decisions weigh on global indices, including Australia.
The ASX 200 initially rallied during Wednesday’s trading session but struggled to hold gains above the AU$8600 level. Despite the early momentum, the index pulled back as market sentiment shifted. This suggests uncertainty remains in the market.
The Australian equities market continues to follow global trends, especially as investors assess the outlook for global economic growth. There are growing concerns about whether the world economy is set for expansion or if weaker economic data will start to emerge. These factors will likely influence the ASX 200’s direction.
Signs of a slowdown in the United States are becoming more apparent. A weaker US economy could weigh on other global indices, including Australia’s. Investors should stay alert to broader economic developments that may impact local markets.
CSL Limited (CSL)
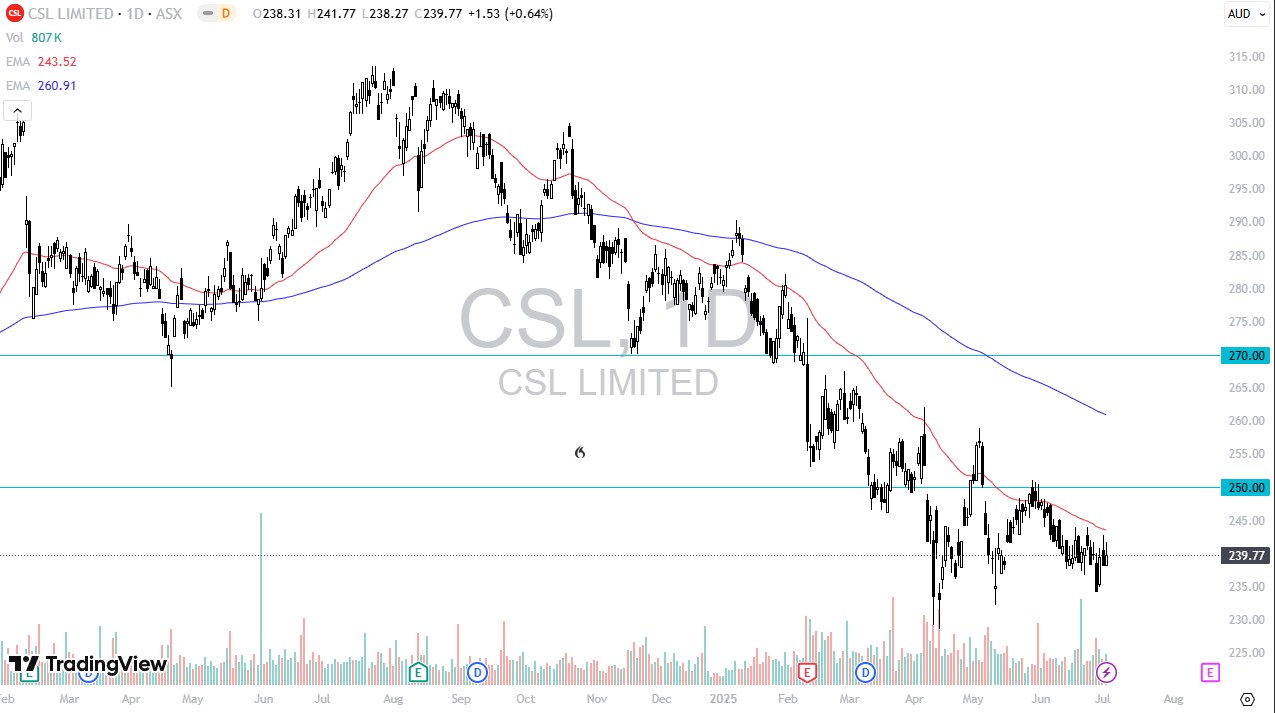
CSL gained 0.64% during Wednesday’s trading session but remains down 2.92% for the month and 17.91% for the year. The healthcare sector has faced challenges, and CSL has been one of the biggest underperformers. This highlights ongoing weakness in the stock’s performance.
CSL closed at AU$239.77, with the 50-day EMA sitting just above that level. The stock has repeatedly dropped to the AU$230 mark, suggesting a persistent downtrend. Market sentiment remains cautious as a result.
Given this setup, traders are likely keeping a close eye on CSL. However, enthusiasm appears limited due to the stock’s recent struggles. It remains a wait-and-see situation for many investors.
Woolworths Group Limited (WOW)
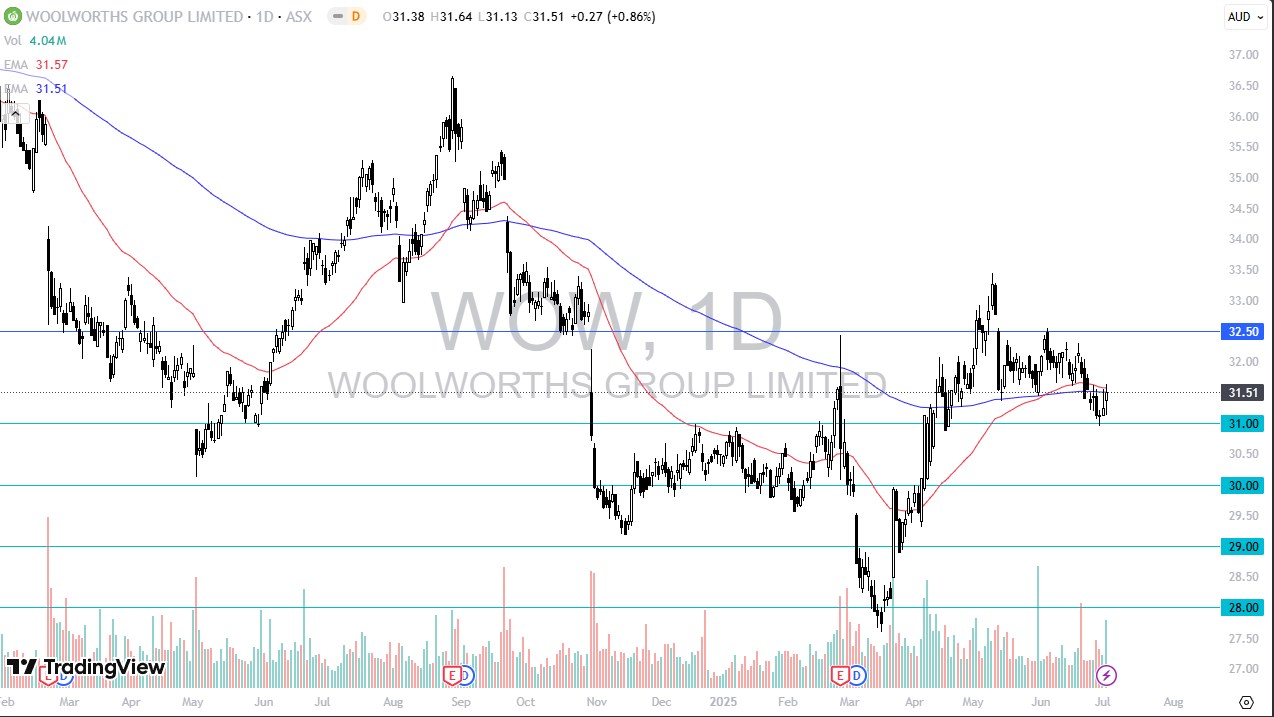
Woolworths Group gained 0.86% during the trading session as the market attempts to recover from the recent selloff. Over the past month, WOW is down 1.07%, and it has fallen 5.38% over the past 12 months. This reflects broader weakness in the consumer staples sector.
Technical traders may be finding the current setup unclear. The stock is hovering between the 200-day and 50-day EMAs, creating mixed signals. This technical overlap often leads to indecision in the market.
The AU$31 level appears to be providing some support. Meanwhile, the AU$32.50 level has acted as strong resistance in the past. Until the price breaks out of this range, sideways movement may continue.
REA Group Limited (REA)
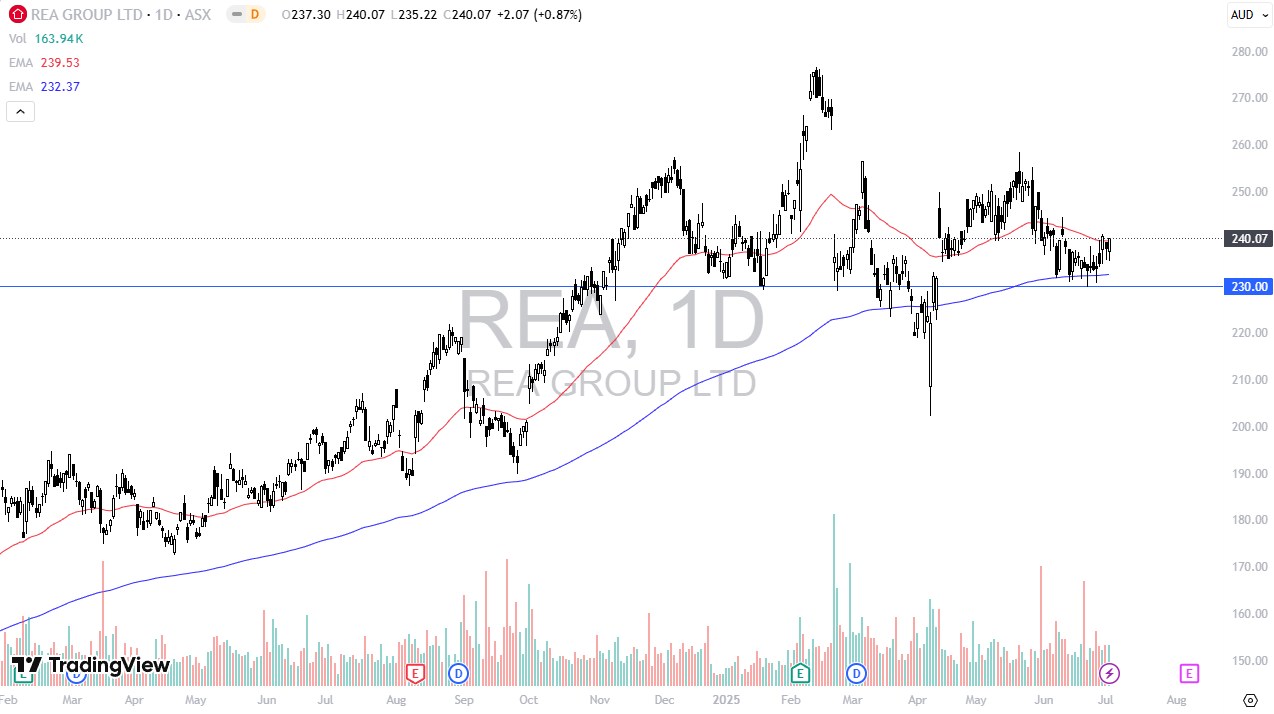
REA Group gained 0.87% during the day, with the stock now up 0.15% over the past month. As a leading communication company, REA has delivered a strong 24.55% gain over the past year. Given that impressive run, a short pause in momentum seems reasonable.
Recently, the stock has been moving sideways, showing signs of consolidation. However, momentum is starting to build again. Perhaps more importantly, trading volume is also picking up, which may indicate growing investor interest.
Woodside Energy Group Limited (WDS)
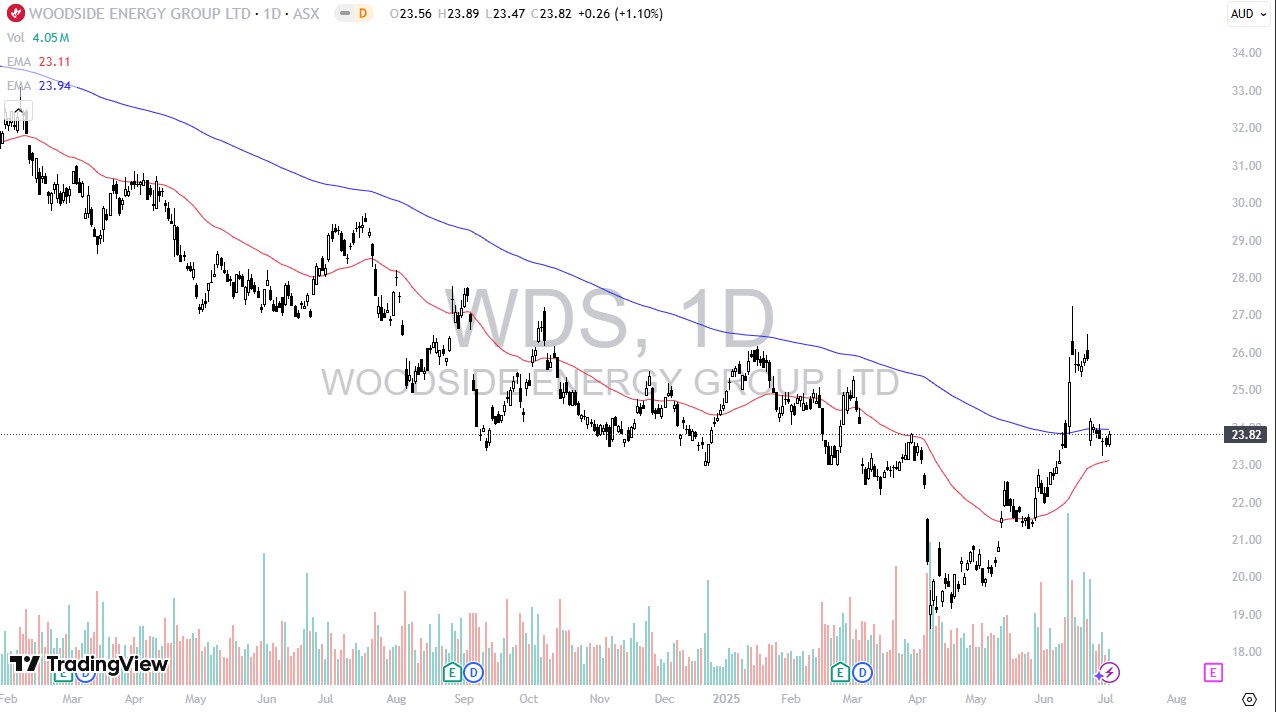
Woodside Energy Group gained 1.10% during Wednesday’s trading session, continuing to build on strong gains over the past month. The stock has risen just over 7% in the last month, showing short-term strength. However, it remains down 18.23% over the past year.
Currently, the stock is trading just below the 200-day EMA and recently experienced a gap lower. Despite that, it appears to be building volume. This could be an attempt to fill the gap and regain lost ground.
Disclaimer: The material provided here has not been prepared in accordance with legal requirements designed to promote the independence of investment research and as such is considered to be a marketing communication. Whilst it is not subject to any prohibition on dealing ahead of the dissemination of investment research we will not seek to take any advantage before providing it to our client. No representation or warranty is given as to the accuracy or completeness of this information and therefore it shouldn’t be relied upon as such. Any research provided does not have regard to specific financial situations, needs or investment objectives. Vantage accepts no responsibility for any use that may be made of these comments and for any consequences that result. Consequently, any person acting on it does so entirely at their own risk. We advise any readers of this material to seek professional advice where necessary. Without the approval of Vantage, reproduction or redistribution of this information isn’t permitted.
-

Open Trading Account
Discover the endless trading possibilities with our cutting-edge platform, designed to empower our traders. Practice trading the markets with a free demo account today.
-

Download Vantage App
Trade on the go with the Vantage All-In-One Trading App, where smooth execution and market access come together in the palm of your hand.
-

Start Trading
Are you an existing user? Login to your account to start trading 1,000+ CFD products including forex, indices, gold, shares and more.
