
-

-


Download App
-


-

-

-
Search query too short. Please enter a full word or phrase.
-

Keywords
- Forex Trading
- Vantage Rewards
- Spreads
Popular Search
- Trading Accounts
- MT4
- MT5
- Copy Trading
- Promotions





Language

 Market Analysis Daily Analysis [DAILY TRADING]: XAUUSD Analysis 3 August 2026: Gold Steadies as Traders Eye US ISM Data
Commodities NewsCommodity Market NewsEconomic News TodayFeatured NewsFederal Reserve NewsGold NewsGold News TodayGold Price NewsGold TradingInterest Rate NewsMarket News TodayTechnical analysisTrending NewsVantage NewsXAUUSD News
[DAILY TRADING]: XAUUSD Analysis 3 August 2026: Gold Steadies as Traders Eye US ISM Data

Vantage Editorial Team >
3 August 2026 | Daily Analysis | 7 min read
Vantage Editorial Team >
Vantage is a global, multi-asset broker with a team of in-house writers and market analysts who produce educational and insightful trading content for traders of all levels.
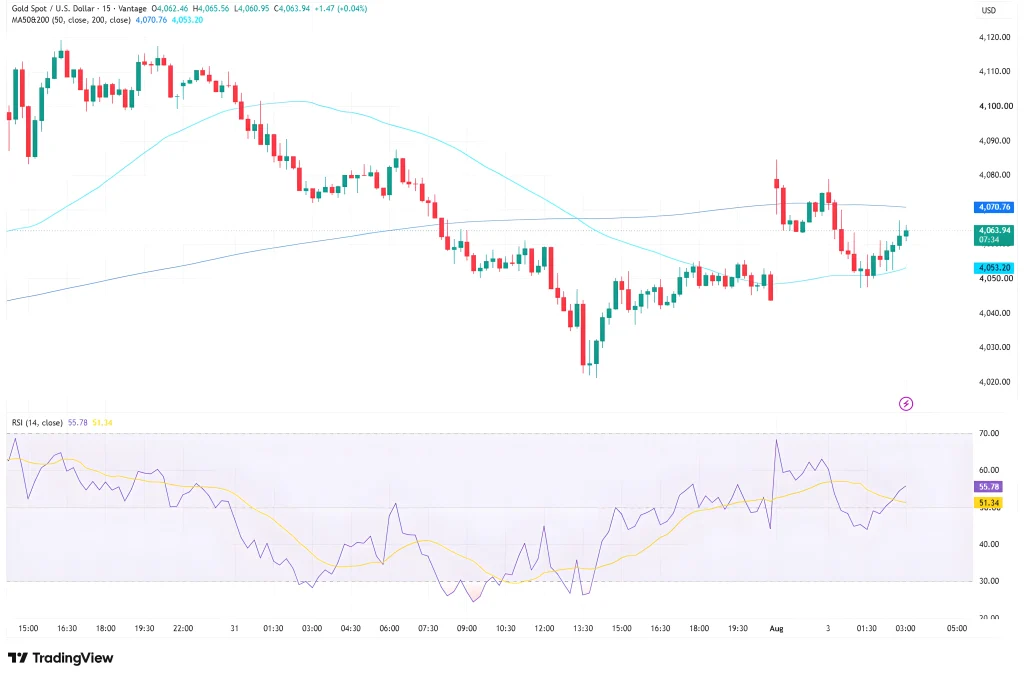
The XAUUSD price sits at $4,063.94 as of 03 August 2026, 11:00 (GMT+8), up a modest $1.47, or +0.04%, on the session. It is the kind of Monday morning gold prices deliver more often than traders expect: plenty of build-up over the past week, not much to show for it yet. This XAUUSD technical analysis reads the 15-minute chart as it stands, the gold price news behind it, and the levels in play into the European session. It does not call where gold goes next.
What the XAUUSD Chart Is Showing
Price is boxed in. It is pinned just under the 50-period moving average, at $4,070.76, and just above the 200-period moving average, at $4,053.20, on the XAUUSD TradingView setup used for this analysis. When two moving averages squeeze the price like that, the chart is usually telling you to wait, not to guess.
RSI (14) sits at 55.78, with its own moving average at 51.34, both comfortably neutral. That is a long way from the plunge toward 30 earlier in the week, or the spike near 68 that followed it. For now, the extremes look to be behind us, and the chart reads like it is catching its breath.
Gold’s Pullback From the Highs, and the Bigger Gold Price News Story

Zoom out and $4,063 barely registers on a chart that touched an all-time high of $5,589.38 on 28 January 2026, according to CBS News.1 Gold prices have given back a large chunk of that since, and the past week has replayed the same script at a smaller scale: a slide toward $4,020, a bounce back above $4,080, and now this pause.
Some of that pullback traces back to the Federal Reserve. The FOMC held its benchmark rate at 3.50% to 3.75% on 29 July 2026 by a 9-3 vote, with three regional Fed presidents (Cleveland’s Beth Hammack, Minneapolis’s Neel Kashkari, and Dallas’s Lorie Logan) dissenting in favour of a hike over inflation concerns.2 The Fed’s own statement from that meeting is on the record in full.3 Firmer Treasury yields since that decision have coincided with gold’s advance losing steam, though the timing is hard to ignore.
What Is Actually Moving XAUUSD This Week
Two things are worth watching before the week gets going. The US ISM Manufacturing PMI for July lands at 10:00 (ET), or 22:00 (GMT+8), later today, and it is the kind of release that can move the dollar quickly if the price or new-orders components surprise in either direction.4
Further out, Fed Chair Kevin Warsh is due to speak at the Jackson Hole symposium, running 27 to 29 August, with the next FOMC decision scheduled for 15 to 16 September 2026.2 Neither event has a scripted outcome. Markets are positioning for both, not predicting either.
Levels To Watch and Risk Framing
The table below covers the zones on the XAUUSD chart worth watching. Treat these as reference levels, not trade signals.
| Level | Price | What’s happening |
| Support | $4,053.20 (200-period MA) | Sits just under the recent session low band |
| Support | Near $4,020 | Marks the recent multi-day low on the chart |
| Resistance | $4,070.76 (50-period MA) | Capped Monday’s early attempts higher |
| Resistance | Near $4,098 to $4,120 | Marks the late-July session highs |
Table 1: Key XAUUSD levels as of 03 August 2026, 11:00 (GMT+8). Source: Vantage XAUUSD CFD and the TradingView setup used for this analysis.
Correlated exposure is worth a second look here too. Gold, the US dollar index, and Treasury-sensitive currency pairs tend to move together on days like today, so traders carrying more than one of them should size the whole book, not just the gold leg.
Given how tightly gold has traded through the Asian morning, a break outside the $4,053.20 to $4,070.76 band would be the first real signal of fresh direction, not before. Stop Loss placement around these levels, and the wider $4,020 to $4,098 zone, matters more than usual in a range this narrow, where a small move can look bigger than it really is.
Leverage on gold CFDs, written here as 1:1000, cuts both ways in a range like this one. Position sizing relative to account equity is worth a second look ahead of today’s ISM print and the data still to come before September’s FOMC meeting.
RISK WARNING: CFDs are complex financial instruments and carry a high risk of losing money rapidly due to leverage. You should ensure you fully understand the risks involved and carefully consider whether you can afford to take the high risk of losing your money before trading.
Disclaimer: The information is provided for educational purposes only and doesn’t take into account your personal objectives, financial circumstances, or needs. It does not constitute investment advice. We encourage you to seek independent advice if necessary. The information has not been prepared in accordance with legal requirements designed to promote the independence of investment research. No representation or warranty is given as to the accuracy or completeness of any information contained within. This material may contain historical or past performance figures and should not be relied on. Furthermore estimates, forward-looking statements, and forecasts cannot be guaranteed. The information on this site and the products and services offered are not intended for distribution to any person in any country or jurisdiction where such distribution or use would be contrary to local law or regulation.
References
1. “What is the highest gold price in history? Here’s how it’s changed over the past year – CBS News” https://www.cbsnews.com/news/highest-gold-price-in-history-how-its-changed-from-2025-to-2026/ Accessed on 03 August 2026.
2. “Fed policymakers leave rates unchanged amid elevated uncertainty – Fox Business” https://www.foxbusiness.com/economy/federal-reserve-interest-rate-decision-july-29-2026 Accessed on 03 August 2026.
3. “Federal Reserve issues FOMC statement – Federal Reserve” https://www.federalreserve.gov/newsevents/pressreleases/monetary20260729a.htm Accessed on 03 August 2026.
4. “Manufacturing PMI at 53.3%; June 2026 ISM Manufacturing PMI Report – PR Newswire” https://www.prnewswire.com/news-releases/manufacturing-pmi-at-53-3-june-2026-ism-manufacturing-pmi-report-302814991.html Accessed on 03 August 2026.
Key Points In This Article

Latest Financial Market News


Market News Tags
- # USD News
- # USDCAD News
- # USDJPY News
- # USDX News
- # Forex News
- # Forex News Today
- # GBPUSD News
- # EURUSD News
- # Currency Trading News
- # AUDUSD news
Related Articles
- US Dollar Index Falls to 98.55 as Yields Ease, Fed Splits
- [DAILY TRADING] Pfizer Stock Price Today 21 August 2026 – $27.82 After CEO’s $1M Share Purchase
- [DAILY TRADING] AUD/USD Analysis 21 August 2026 — AUD/USD Hits 0.7150 as Dollar Slides, Aussie Jobs Miss
- [DAILY TRADING] Nasdaq 100 21 August 2026 – Climbs Back to 29,347 as Wall Street Waits on Jackson Hole
- PLTR Stock Price Today: August 2026 Chart Breakout & Key Levels
- [DAILY TRADING] Oracle Stock 21 August 2026 – ORCL Holds $142 as Pipeline Delay Meets Debt Fears
- [DAILY TRADING]: EUR/USD Analysis 21 August 2026 — EUR/USD Holds 1.1697, Near 3-Month High, ECB Hike Bets Firm
- [DAILY TRADING] Alibaba 21 August 2026 – BABA Stock Price Rebounds to $130.57 After Earnings Miss