
-

-


Download App
-


-

-

-
Search query too short. Please enter a full word or phrase.
-

Keywords
- Forex Trading
- Vantage Rewards
- Spreads
Popular Search
- Trading Accounts
- MT4
- MT5
- Copy Trading
- Promotions





Weekly Outlook | Corrective Momentum Amid Dollar Strength

Vantage Editorial Team >
19 May 2026 | Market Analysis | 4 min read
Vantage Editorial Team >
Vantage is a global, multi-asset broker with a team of in-house writers and market analysts who produce educational and insightful trading content for traders of all levels.

Kevin Warsh, the designated boss of the Federal Reserve in the United States has taken over office. Will he also disappoint President Trump? The war with Iran remains unsolved, the pressure of inflation keeps rising and with this he will likely not be able to cut interest rates. Previously, Trump pointed out that he will be “highly disappointed” if such move will not be implemented immediately.
Before taking office, Kevin Warsh had pointed out that lower interest rates will be appropriate but with the increase in geopolitical tensions this might be in far distance now. Yet, he also aims to use other models to measure inflation, which had been criticized in the past, especially during times of crisis.
In general, equities started a potential correction as we examine below. In particular the Dollar gearing up fresh momentum might cause negative market sentiment. Geopolitical tensions have been rising again and as a result oil prices keep rising. In the meantime, shipping companies divert cargo also to land routes, as the Strait of Hormuz remains closed.
Important events this week:
– US –FOMC Meeting Minutes– The meeting Minutes are generally not very important for market guidance in general, as the data is two weeks old. The current release might be different, though. With the Fed now having their new chair potential disagreement of future rate moves during the last meeting might offer interesting insights. Especially concern about slowing growth against the pressure of inflation might shed more light on what policy Kevin Warsh might now start to adopt.
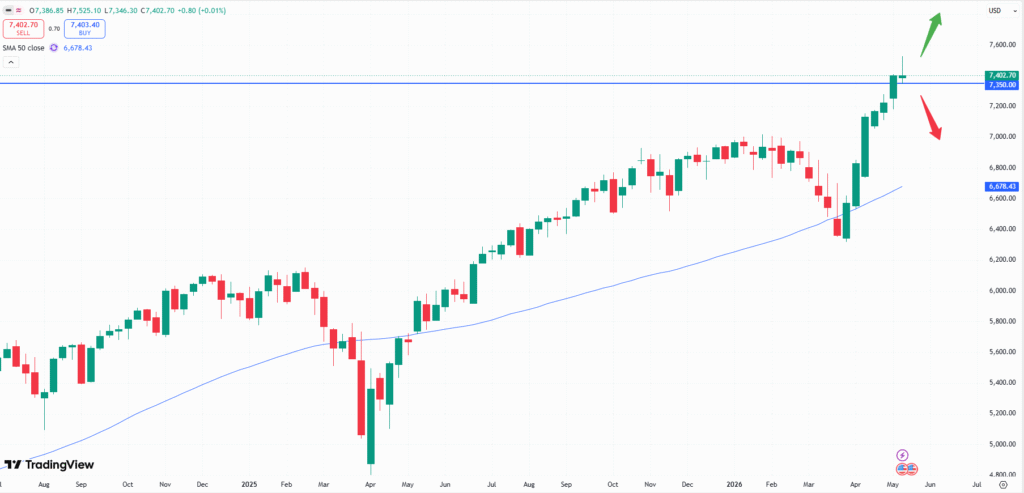
S&P 500 weekly chart
The S&P 500 index shows some potential bearish momentum. The weekly chart above printed a pinbar candlestick pattern, which might indicate that prices could fall. If the index can break above the 7,550 level, the market might continue to rise. If the price breaks below the 7,350 level a correction might be on the cards, which seems more likely. Given the developing strength of the Dollar, US indices usually tend to weaken. That could also help as a trigger. The FOMC meeting minutes will be released on Wednesday, 20th of May at 20:00 CET.
– UK – flash manufacturing pmi– The purchasing manager indices are both expected to come in slightly weaker from the UK. While still above the level of 50, which would indicate expansion, a weaker reading might also cause the GBP to weaken.
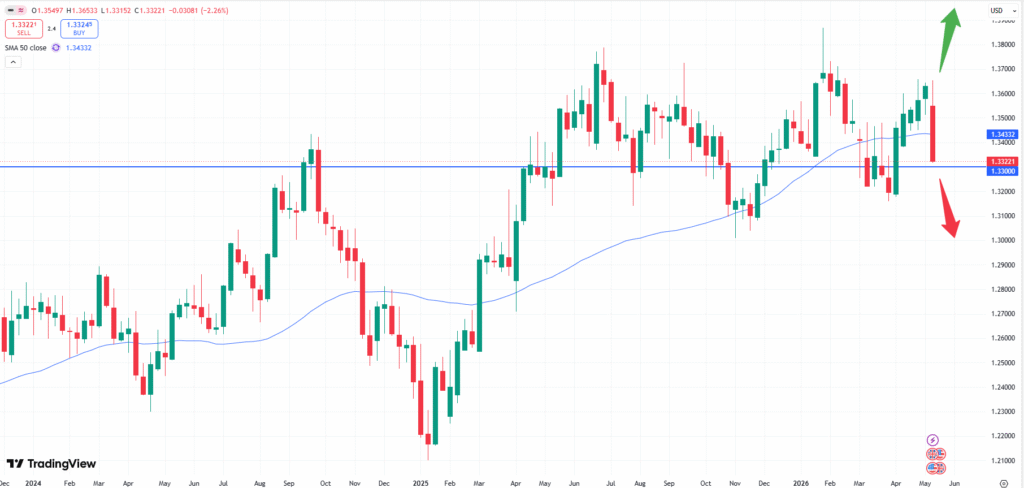
GBPUSD weekly chart
The weekly chart above shows signs of a potential bearish correction. Last week, the price broke below the 50- moving average zone. If the GBPUSD pair continues to trade below that level the correction might continue. Especially last week’s big candlestick might also show that more downside could emerge. On the other hand, if the market starts pushing back above the 1.3460 level the positive sentiment might continue. The purchasing manager indices will be released on Thursday, 21st of May.
Key Points In This Article

Latest Financial Market News


Market News Tags
- # USD News
- # USDCAD News
- # USDJPY News
- # USDX News
- # Forex News
- # Forex News Today
- # GBPUSD News
- # EURUSD News
- # Currency Trading News
- # AUDUSD news
Related Articles
- US Dollar Index Falls to 98.55 as Yields Ease, Fed Splits
- Week Ahead: Jackson Hole and Treasury markets
- [DAILY TRADING] Pfizer Stock Price Today 21 August 2026 – $27.82 After CEO’s $1M Share Purchase
- [DAILY TRADING] AUD/USD Analysis 21 August 2026 — AUD/USD Hits 0.7150 as Dollar Slides, Aussie Jobs Miss
- [DAILY TRADING] Nasdaq 100 21 August 2026 – Climbs Back to 29,347 as Wall Street Waits on Jackson Hole
- PLTR Stock Price Today: August 2026 Chart Breakout & Key Levels
- [DAILY TRADING] Oracle Stock 21 August 2026 – ORCL Holds $142 as Pipeline Delay Meets Debt Fears
- [DAILY TRADING]: EUR/USD Analysis 21 August 2026 — EUR/USD Holds 1.1697, Near 3-Month High, ECB Hike Bets Firm