
-

-


Download App
-


-

-

-
Search query too short. Please enter a full word or phrase.
-

Keywords
- Forex Trading
- Vantage Rewards
- Spreads
Popular Search
- Trading Accounts
- MT4
- MT5
- Copy Trading
- Promotions





Language


CPI NewsEconomic News TodayFeatured NewsFederal Reserve NewsForex NewsIndices NewsInterest Rate NewsMarket News TodayNFP NewsTechnical analysisTrading NewsTrending NewsUSD NewsUSDX NewsVantage News
US Dollar Index (DXY): USDX Falls to 99.30 as Fed Splits 9-3

Vantage Editorial Team >
17 August 2026 | Market Analysis | 11 min read
Vantage Editorial Team >
Vantage is a global, multi-asset broker with a team of in-house writers and market analysts who produce educational and insightful trading content for traders of all levels.
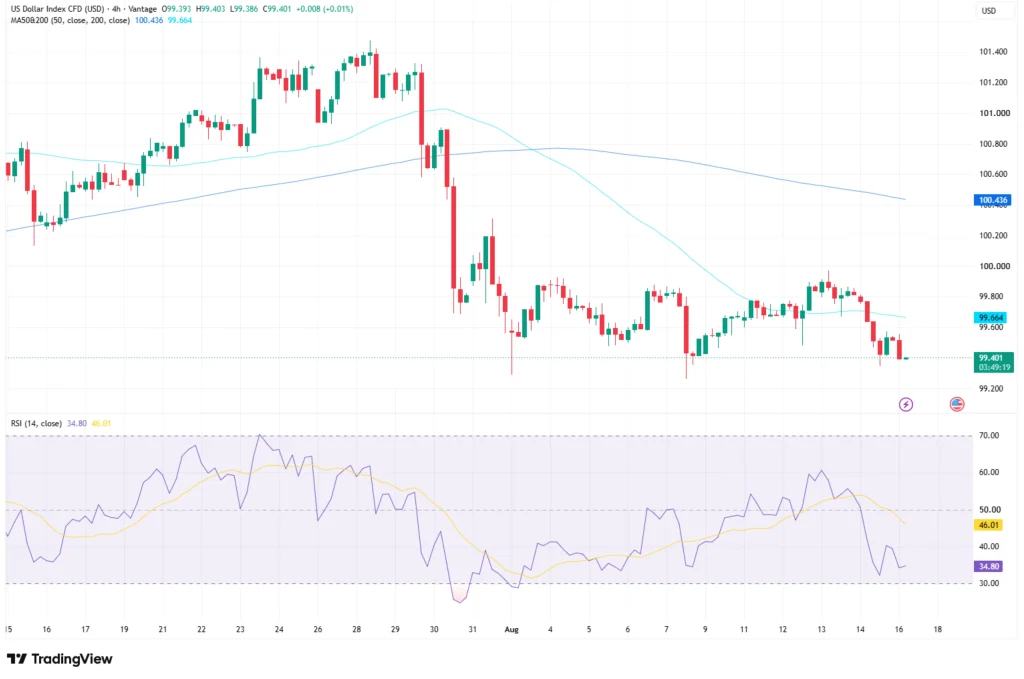
The US Dollar Index has had a rough few weeks, and today’s USDX chart shows exactly why. All price references below come from the Vantage USDX CFD four-hour chart, cut off at 02:10 UTC on 17 August 2026.1 At that cut-off, the dollar index today sits at 99.401, essentially flat on the session and right back at the same support shelf it first tested in early August.
Three weeks ago this same instrument, USDX on some platforms, DXY index on others, was trading comfortably above 101.40. Something changed. Actually, three somethings changed, almost back to back: a Federal Reserve that could not agree with itself, a jobs report that stunned nearly everyone, and two inflation prints that came in soft rather than hot. That is the US dollar index story of August so far, and this week’s dollar index chart lays it out candle by candle.
What the Dollar Index Chart Is Showing Today
The four-hour dollar index chart tells a clean two-stage story. USDX climbed from around 100.60 in mid-July to a peak above 101.40 by 24 July, the kind of steady grind that makes a chart look almost boring, right before it reversed hard in the final days of the month. That reversal took the index from above 100.80 down to around 99.60 in a handful of sessions, and it has spent most of August consolidating in a 99.30 to 100.00 range, occasionally testing the edges but never quite breaking free of them.
The 50-period moving average sits at 100.436 and the 200-period average at 99.664, with price currently trading below both.1 That flips the two averages from support into overhead resistance, and the 200-period line in particular now sits at the top of the recent consolidation range, a lid rather than a floor. The Relative Strength Index reads 34.80, below its own moving average of 46.01, which points to fading short-term momentum rather than a full oversold extreme. RSI briefly dipped into oversold territory below 30 in the final days of July; the current reading has not gone that low, so this looks more like a tired dollar than a broken one.1
A Divided Fed and a Weak Jobs Report
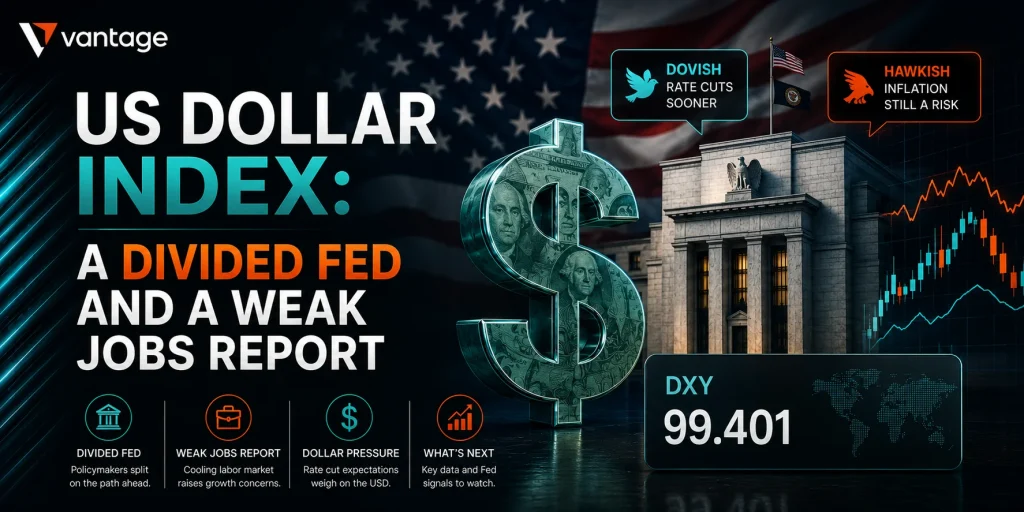
The Federal Reserve held the federal funds rate at 3.50% to 3.75% on 29 July, the fifth consecutive hold at this level so far in 2026.2,3 Three regional presidents, Beth Hammack of Cleveland, Neel Kashkari of Minneapolis, and Lorie Logan of Dallas, dissented in favour of a quarter-point hike, the most dissents on a single decision since 2016.2,3 Fed Chair Kevin Warsh described the debate as a “good family fight,” which might be the most Fed sentence ever spoken, and the committee’s statement pointed to elevated uncertainty tied in part to the conflict in the Middle East.3,8
Eight days later, the labour market surprised in the other direction entirely. Nonfarm payrolls fell by 23,000 in July against a forecast gain of around 80,000, and combined revisions cut a further 103,000 jobs from the May and June totals.4 The unemployment rate ticked down to 4.1%, largely because the participation rate fell to 61.4% rather than because hiring picked up, which is a bit like a scale reading lighter because someone stepped off it. Average hourly earnings growth slowed to 3.2% year on year, the softest pace since May 2021.4
Inflation Cooled Twice in a Row, but the Fed Isn’t Celebrating
The Consumer Price Index rose 0.1% in July, with the annual rate easing to 3.4% from 3.5%.5 Core CPI, which excludes food and energy, rose 0.2% on the month and 2.5% on the year, both a touch softer than June.5 The following day’s producer price data told a similar story: producer prices for final demand were flat in July against a forecast increase of 0.2%, though the annual rate still sits at 4.7%.6
Two soft inflation prints in a row have taken some of the pressure off the Fed to hike in September, even as three FOMC members continue to push for exactly that.3,5 That tension, a hawkish minority set against a cooling data trend, is a large part of why the US dollar index has struggled to hold its early-August recovery. Elevated energy costs tied to the Middle East conflict remain a wildcard for the inflation path over the rest of the year, even as the headline numbers cool.5
Levels to Watch and What Happens Next
Anyone searching for the US Dollar Index DXY levels this week will find them compressed into a fairly narrow band. The table below covers the zones this dollar index chart is centred on right now. These are reference levels drawn from the chart, not trade signals, so treat them as a map rather than a set of instructions.
| Level | Price (USDX) | What it represents |
| Near-term support | 99.30 to 99.40 | Current session and the early-August range low |
| First resistance | 99.60 to 99.70 | 200-period moving average |
| Second resistance | 100.40 | 50-period moving average |
| Range high | 101.40 to 101.60 | Late-July swing high |
Levels are drawn from the Vantage USDX CFD four-hour chart, referenced as of 17 August 2026.
A dense run of events lies ahead. Minutes from the 28 to 29 July FOMC meeting are due on 19 August, and should show how far apart the hawkish dissenters and the majority actually are.3 The Jackson Hole Economic Symposium runs from 27 to 29 August, with Chair Warsh delivering his first keynote as Fed chair on 28 August, a speech markets will read closely for any shift in tone.7,8 The next scheduled FOMC decision follows on 15 to 16 September, by which point this USD index chart could look quite different again.
With price compressed between the 50- and 200-period moving averages and the RSI sitting in the high 30s, four-hour ranges have been narrower and choppier than earlier in the month. In this kind of environment, Stop Loss placement matters more than usual. A Stop Loss limits losses to a planned size rather than preventing them altogether, and levels set too close to current price risk being caught by ordinary intraday noise around the 99.30 to 99.70 zone.
Leverage works both ways in a range like this one, amplifying gains and losses alike, so treat it as a double-edged tool rather than a shortcut. Anyone holding positions on EURUSD, USDJPY, or other USD pairs correlated to the index may want to check combined exposure rather than treating each position in isolation. Position sizing relative to account equity is worth revisiting ahead of the FOMC minutes on 19 August and the Jackson Hole symposium later in the month. Momentum tools like the Relative Strength Index can help frame that decision, and the index itself can be followed or traded directly through Vantage’s forex CFDs.
RISK WARNING: CFDs are complex financial instruments and carry a high risk of losing money rapidly due to leverage. You should ensure you fully understand the risks involved and carefully consider whether you can afford to take the high risk of losing your money before trading.
Disclaimer: The information is provided for educational purposes only and doesn’t take into account your personal objectives, financial circumstances, or needs. It does not constitute investment advice. We encourage you to seek independent advice if necessary. The information has not been prepared in accordance with legal requirements designed to promote the independence of investment research. No representation or warranty is given as to the accuracy or completeness of any information contained within. This material may contain historical or past performance figures and should not be relied on. Furthermore estimates, forward-looking statements, and forecasts cannot be guaranteed. The information on this site and the products and services offered are not intended for distribution to any person in any country or jurisdiction where such distribution or use would be contrary to local law or regulation.
References
[1] “US Dollar Index (USDX) 4-Hour Chart – TradingView” https://www.tradingview.com/symbols/TVC-DXY/ Accessed on 17 August 2026.
[2] “Fed Holds Rates Steady as Three Officials Dissent in Favor of a Hike – Bloomberg” https://www.bloomberg.com/news/articles/2026-07-29/fed-holds-rates-steady-three-officials-dissent-favoring-a-hike Accessed on 17 August 2026.
[3] “Fed rate decision July 2026: Divided Fed holds interest rates steady – CNBC” https://www.cnbc.com/2026/07/29/fed-rate-decision-july-2026.html Accessed on 17 August 2026.
[4] “Jobs report July 2026 – CNBC” https://www.cnbc.com/2026/08/07/jobs-report-july-2026.html Accessed on 17 August 2026.
[5] “CPI inflation report July 2026 – CNBC” https://www.cnbc.com/2026/08/12/cpi-inflation-report-july-2026.html Accessed on 17 August 2026.
[6] “Producer Price Index News Release – U.S. Bureau of Labor Statistics” https://www.bls.gov/news.release/ppi.nr0.htm Accessed on 17 August 2026.
[7] “Jackson Hole Economic Symposium – Federal Reserve Bank of Kansas City” https://www.kansascityfed.org/research/jackson-hole-economic-symposium/ Accessed on 17 August 2026.
[8] “Fed meeting recap: Warsh says Fed won’t hesitate to stop inflation, but bond market has doubts – CNBC” https://www.cnbc.com/2026/07/29/fed-meeting-today-live-updates.html Accessed on 17 August 2026.
[9] “Fed’s Interest Rate Decision: July 29, 2026 – Advisor Perspectives” https://www.advisorperspectives.com/dshort/updates/2026/07/29/feds-interest-rate-decision-july-29-2026 Accessed on 17 August 2026.
Key Points In This Article

Latest Financial Market News


Market News Tags
- # USD News
- # USDCAD News
- # USDJPY News
- # USDX News
- # Forex News
- # Forex News Today
- # GBPUSD News
- # EURUSD News
- # Currency Trading News
- # AUDUSD news
Related Articles
- US Dollar Index Falls to 98.55 as Yields Ease, Fed Splits
- [DAILY TRADING] Pfizer Stock Price Today 21 August 2026 – $27.82 After CEO’s $1M Share Purchase
- [DAILY TRADING] AUD/USD Analysis 21 August 2026 — AUD/USD Hits 0.7150 as Dollar Slides, Aussie Jobs Miss
- [DAILY TRADING] Nasdaq 100 21 August 2026 – Climbs Back to 29,347 as Wall Street Waits on Jackson Hole
- PLTR Stock Price Today: August 2026 Chart Breakout & Key Levels
- [DAILY TRADING] Oracle Stock 21 August 2026 – ORCL Holds $142 as Pipeline Delay Meets Debt Fears
- [DAILY TRADING]: EUR/USD Analysis 21 August 2026 — EUR/USD Holds 1.1697, Near 3-Month High, ECB Hike Bets Firm
- [DAILY TRADING] Alibaba 21 August 2026 – BABA Stock Price Rebounds to $130.57 After Earnings Miss