
-

-


Download App
-


-

-

-
Search query too short. Please enter a full word or phrase.
-

Keywords
- Forex Trading
- Vantage Rewards
- Spreads
Popular Search
- Trading Accounts
- MT4
- MT5
- Copy Trading
- Promotions





Language


Economic News TodayEURUSD NewsFeatured NewsFederal Reserve NewsFinancial NewsForex NewsInterest Rate NewsMarket News TodayNFP NewsTechnical analysisTrending NewsUSD NewsUSDJPY NewsUSDX NewsVantage News
Dollar Index (DXY): Fed Split and Jobs Shock Rattle the Greenback

Vantage Editorial Team >
10 August 2026 | Market Analysis | 10 min read
Vantage Editorial Team >
Vantage is a global, multi-asset broker with a team of in-house writers and market analysts who produce educational and insightful trading content for traders of all levels.
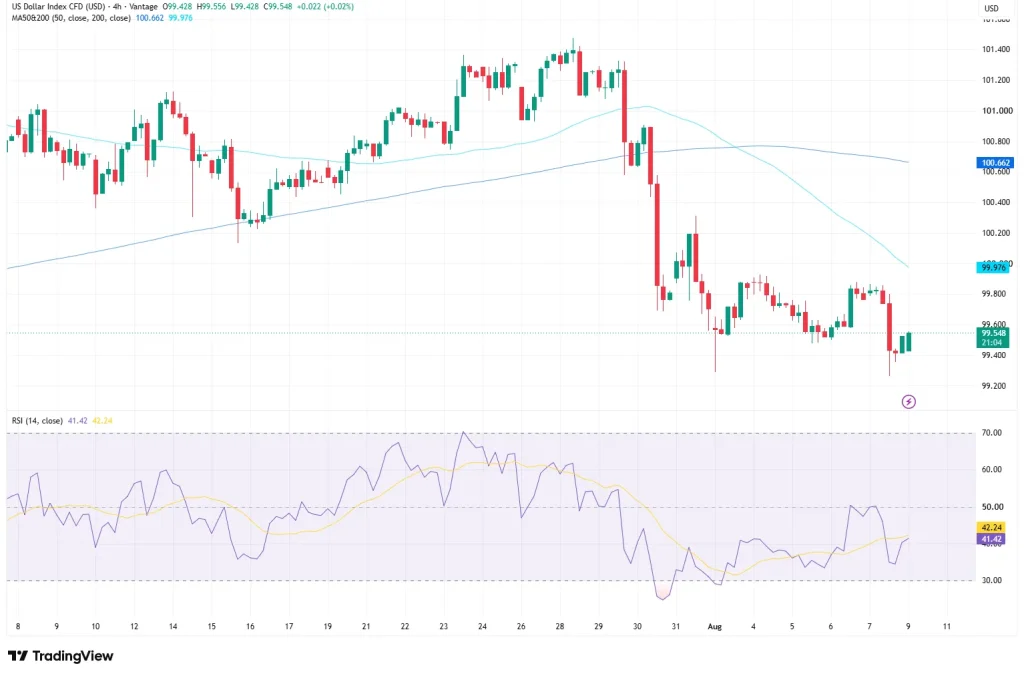
The US Dollar Index has had a rough couple of weeks. Vantage US Dollar Index CFD data shows USDX at 99.548 on 10 August 2026, having handed back the entire rally that took it above 101.60 in late July.1,2 That is the kind of reversal that gets a trading desk’s attention.
Two events did the damage, six days apart. The Federal Reserve held rates on 29 July, with three policymakers pushing to hike rather than cut.3 Then, on 7 August, the July jobs report showed the US economy losing jobs rather than adding them.4 The dollar has been trying to find its footing since. All levels below come off the four-hour Vantage USDX CFD chart and are informational, not trade signals.
Key Points
- USDX traded near 99.548 on 10 August 2026, down from a late-July high above 101.60, after a split Fed decision and a surprise jobs loss pulled it below its 50 and 200-period moving averages.
- Nonfarm payrolls fell by 23,000 in July against a forecast gain of 80,000, and unemployment eased to 4.1%, pushing rate-futures pricing toward a Fed hold in September.
- The next catalysts are August CPI on 11 September and the FOMC meeting on 16 and 17 September, both landing before markets decide whether the dollar’s slide continues.
USDX Chart Today: What The Dollar Index is Showing
Zoom out to early July and the dollar index chart looks almost boring: USDX grinding higher from a base near 100.60 to a peak above 101.60 by 24 July.5 Then the chart does something a boring chart is not supposed to do. It falls off a ledge.
The drop accelerated the moment the Fed’s statement hit the wires, then got another shove once the jobs numbers landed on 7 August. Within days, USDX was trading near 99.40, a level it has now tested twice without breaking cleanly through it.
The 50-period and 200-period moving averages on the Vantage USDX CFD chart, at 99.976 and 100.662 respectively, now both sit above the current price. Not a great look for the bulls, but worth being precise about what it does and does not mean. It says momentum has cooled. It does not say the trend has flipped.
The Relative Strength Index on the TradingView setup used for this analysis backs that up. It read 41.42, with its signal line at 42.24, soft but nowhere near the oversold reading near 30 the index touched during the late-July sell-off. In plain terms, the selling has slowed. It has not reversed.
The Fed Rate Decision and Jobs Shock Behind the Move
Start with the Fed rate decision. On 29 July, the Federal Open Market Committee held the federal funds rate at 3.50% to 3.75% for a second straight meeting, and three members dissented in favour of a hike rather than a cut.3 A genuinely divided committee, and the statement’s talk of elevated uncertainty and low average job gains settled nothing.
Then came the number that actually moved the market. Nonfarm payrolls fell by 23,000 in July, against a forecast gain of 80,000, and revisions wiped a further 103,000 jobs off the May and June totals combined.4 Average hourly earnings growth slowed to 3.2% year on year, the softest pace since May 2021.3 The unemployment rate ticked down to 4.1%, but mostly because fewer people were looking for work, which is not the good kind of improvement.3
Put the two together and it is easy to see why rate-futures pricing has swung toward a Fed hold in September, a real shift from the hawkish mood through most of July.6 The dollar has simply stopped getting the benefit of the doubt.
EURUSD Outlook and USDJPY Forecast: How The Majors Are Responding

The pullback in USDX has rippled out everywhere. EURUSD traded near 1.156 this week, holding above the 1.14 area that had capped it in late July.7 USDJPY told a different story, dropping to around 157.80 from the 163 to 164 zone seen in late July, after Japan’s Ministry of Finance and the US Treasury confirmed a coordinated yen-buying intervention on 31 July and the Bank of Japan separately flagged a possible September move.8 GBPUSD traded near 1.349.7
Worth saying plainly: this is not one dollar story wearing three masks. The yen’s move owes as much to intervention and a BoJ rate-hike watch as to Washington, while the euro and sterling gains look like the mirror image of a soft jobs print rather than fresh strength of their own.
Dollar Index Forecast: Levels to Watch into September
The table below covers USDX only, read directly off the Vantage USDX CFD chart. Support and resistance for individual currency pairs vary by source and methodology, so rather than presenting invented precision for EURUSD, USDJPY and GBPUSD, the current levels for those pairs are covered qualitatively above. These are reference levels, not trade signals.
| USDX Price | Type | What’s happening |
| 99.40 | Recent support | Tested twice since 31 July without a clean break |
| 99.90 | Recent resistance | Local high during the 6 to 7 August bounce |
| 99.976 | 50-period MA | Overhead resistance on the 4H chart |
| 100.662 | 200-period MA | Further overhead resistance above that |
Table 1: Key USDX levels as of 10 August 2026, read from the Vantage USDX CFD chart (Figure 1). Indicative only.
Beyond the immediate range, the calendar does the talking: August CPI lands on 11 September, the last inflation read before the Fed meets again, followed swiftly by the FOMC decision on 16 and 17 September.9 Five days is not much breathing room, and markets will likely treat the CPI print as the bigger of the two.
Managing Exposure into the Next Data Window
USDX moved more than a full point in the week the crash happened, and days like 7 August can blow straight through a normal intraday range. Stop Loss placement around the 99.40 support and the 99.90 resistance is worth a second look given how fast this has shifted. Anyone holding correlated positions elsewhere, short JPY or long EUR for instance, might want to check their combined exposure to a single dollar move too.
Leverage lets a trader control a bigger position with a smaller amount of capital, and it cuts both ways with no exceptions. On a Vantage US Dollar Index CFD, available leverage varies by entity and jurisdiction, and in a range like this one it amplifies losses exactly as readily as gains. Position sizing relative to account equity, not conviction about September, is the more durable habit here.
RISK WARNING: CFDs are complex financial instruments and carry a high risk of losing money rapidly due to leverage. You should ensure you fully understand the risks involved and carefully consider whether you can afford to take the high risk of losing your money before trading.
Disclaimer: The information is provided for educational purposes only and doesn’t take into account your personal objectives, financial circumstances, or needs. It does not constitute investment advice. We encourage you to seek independent advice if necessary. The information has not been prepared in accordance with legal requirements designed to promote the independence of investment research. No representation or warranty is given as to the accuracy or completeness of any information contained within. This material may contain historical or past performance figures and should not be relied on. Furthermore estimates, forward-looking statements, and forecasts cannot be guaranteed. The information on this site and the products and services offered are not intended for distribution to any person in any country or jurisdiction where such distribution or use would be contrary to local law or regulation.
References
[1] “Foreign Exchange Rates – DXY U.S. Dollar Index” https://streetstats.finance/liquidity/fx Accessed on 10 August 2026.
[2] “US Dollar Index Forecast | Fed Rate Hold, Trade Deficit Widens – Capital.com” https://capital.com/en-int/analysis/usd-forecast Accessed on 10 August 2026.
[3] “Jobs report July 2026 – CNBC” https://www.cnbc.com/2026/08/07/jobs-report-july-2026.html Accessed on 10 August 2026.
[4] “Employment Situation Summary – 2026 M07 Results – U.S. Bureau of Labor Statistics” https://www.bls.gov/news.release/empsit.nr0.htm Accessed on 10 August 2026.
[5] “US Dollar Index (DXY) Forecast 2026: 6-Month Dollar Outlook – Cambridge Currencies” https://cambridgecurrencies.com/us-dollar-index-dxy-forecast/ Accessed on 10 August 2026.
[6] “U.S. Dollar Retreats As Non Farm Payrolls Drop – Yahoo Finance” https://finance.yahoo.com/markets/currencies/articles/u-dollar-retreats-non-farm-163958695.html Accessed on 10 August 2026.
[7] “USD/JPY (USDJPY=X) Stock Historical Prices & Data – Yahoo Finance” https://finance.yahoo.com/quote/USDJPY=X/history/ Accessed on 10 August 2026.
[8] “U.S., Japan confirm coordinated yen intervention, signal readiness for more – CNBC” https://www.cnbc.com/2026/08/03/yen-intervention-us-japan-trump-bessent-katayama.html Accessed on 10 August 2026.
[9] “The Federal Reserve Just Released Its August Inflation Forecast – The Motley Fool” https://www.fool.com/investing/2026/08/09/federal-reserve-just-released-august-inflation/ Accessed on 10 August 2026.
Key Points In This Article

Latest Financial Market News


Market News Tags
- # USD News
- # USDCAD News
- # USDJPY News
- # USDX News
- # Forex News
- # Forex News Today
- # GBPUSD News
- # EURUSD News
- # Currency Trading News
- # AUDUSD news
Related Articles
- US Dollar Index Falls to 98.55 as Yields Ease, Fed Splits
- [DAILY TRADING] Pfizer Stock Price Today 21 August 2026 – $27.82 After CEO’s $1M Share Purchase
- [DAILY TRADING] AUD/USD Analysis 21 August 2026 — AUD/USD Hits 0.7150 as Dollar Slides, Aussie Jobs Miss
- [DAILY TRADING] Nasdaq 100 21 August 2026 – Climbs Back to 29,347 as Wall Street Waits on Jackson Hole
- PLTR Stock Price Today: August 2026 Chart Breakout & Key Levels
- [DAILY TRADING] Oracle Stock 21 August 2026 – ORCL Holds $142 as Pipeline Delay Meets Debt Fears
- [DAILY TRADING]: EUR/USD Analysis 21 August 2026 — EUR/USD Holds 1.1697, Near 3-Month High, ECB Hike Bets Firm
- [DAILY TRADING] Alibaba 21 August 2026 – BABA Stock Price Rebounds to $130.57 After Earnings Miss