
-

-


Download App
-


-

-

-
Search query too short. Please enter a full word or phrase.
-

Keywords
- Forex Trading
- Vantage Rewards
- Spreads
Popular Search
- Trading Accounts
- MT4
- MT5
- Copy Trading
- Promotions





Language

 Market Analysis Daily Analysis [DAILY TRADING] NVDA Analysis 18 June 2026 – Nvidia Stock Drops 9% in a Month Despite Record $81.6B Earnings
Earnings News TodayFeatured NewsFinancial NewsMarket News TodayNVIDIA NewsStock Market NewsStock Market News TodayTechnical analysisTrending News
[DAILY TRADING] NVDA Analysis 18 June 2026 – Nvidia Stock Drops 9% in a Month Despite Record $81.6B Earnings

Vantage Editorial Team >
18 June 2026 | Daily Analysis | 10 min read
Vantage Editorial Team >
Vantage is a global, multi-asset broker with a team of in-house writers and market analysts who produce educational and insightful trading content for traders of all levels.
Nvidia Corporation (NVDA) was at $204.67 on the Vantage NVDA CFD as of 07:55 UTC on 18 June 2026 (15:55 GMT+8), up $0.79 (+0.39%) from the prior session close. That puts NVDA roughly 9% below its early-June 2026 high near $225, trading below both the 50-period moving average (MA) at $206.34 and the 200-period MA at $207.87 on the 15-minute chart. A record earnings beat in May 2026 and a $25 billion bond deal completed just days ago have not been enough to hold the stock at higher levels.
All prices are from the Vantage NVDA CFD as of 07:55 UTC on 18 June 2026 (15:55 GMT+8). Charts are indicative and sourced from TradingView. This is not financial advice.
Key Points
- Nvidia stock is at $204.67 on 18 June 2026, sitting below the 50-period MA ($206.34) and 200-period MA ($207.87) on the 15-minute chart. The RSI at 38.52 reflects weak momentum, though the stock is not yet in oversold territory.
- NVDA posted record Q1 FY2027 revenue of $81.6 billion (+85% year-on-year) on 20 May 2026, then returned to the bond market on 15 June 2026 with a $25 billion deal that drew $85 billion in demand.[1][3]
- The zones traders are monitoring: $202.50 as near-term support, and the $206.34-$207.87 MA cluster as the resistance band overhead.
What the Nvidia Stock Price Chart Shows
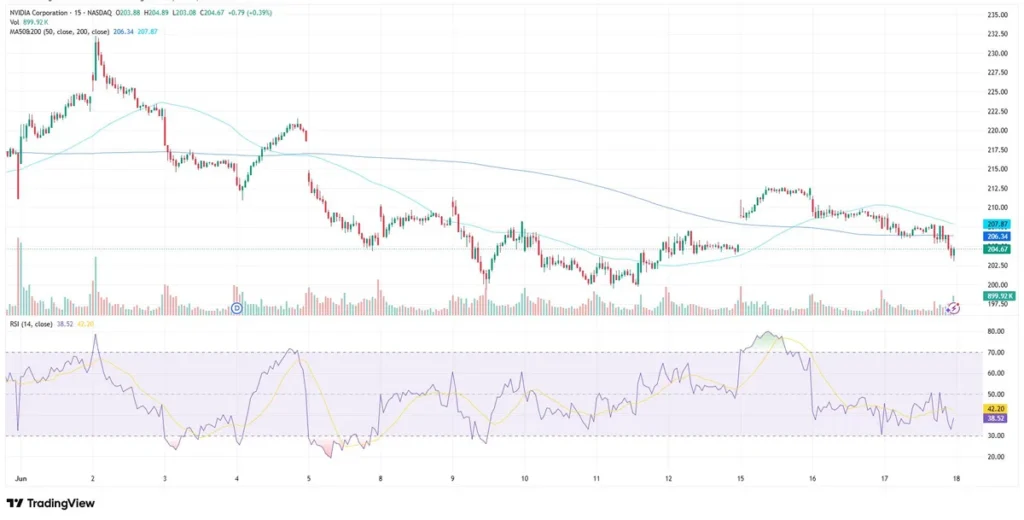
NVDA opened June consolidating near $220-$225 before a sharp drop on 3 June brought price toward $205. A partial recovery followed through 5-8 June 2026. Renewed selling pressure emerged after mid-June, coinciding with the completion of Nvidia’s bond offering and a broader pullback in technology shares.
As of 07:55 UTC on 18 June 2026, price is at $204.67, below both moving averages. The 50-period MA at $206.34 and the 200-period MA at $207.87 form a resistance band $1.70-$3.20 above current price. With the 50-period MA beneath the 200-period MA, the chart reflects the compression that has developed since the mid-June 2026 high near $213.
The RSI (14) as reported by the TradingView setup used for this analysis reads 38.52, with its signal line at 42.20. RSI is below 40 but has not reached the 30-level that would characterise extreme oversold conditions. Momentum is weak; no clear divergence is visible at this stage.
Nvidia News Today: Record Earnings, Then a $25 Billion Bond
On 20 May 2026, NVDA reported Q1 FY2027 results: record revenue of $81.6 billion, up 85% year-on-year and 20% sequentially, marking another quarter of strong sequential revenue growth.[1] Data Centre revenue reached $75.2 billion, up 92% year-on-year, driven by Blackwell architecture demand.
The dominant Nvidia AI news from that call was CEO Jensen Huang’s statement that agentic AI had arrived and demand had gone parabolic.[6] The company authorised an $80 billion share buyback and raised its quarterly cash dividend from $0.01 per share to $0.25 per share. For Q2 FY2027, NVDA guided for revenue of $91.0 billion, plus or minus 2%.[2]
Despite that result, the stock did not sustain post-earnings gains. On 15 June 2026, NVDA returned to the bond market for the first time since 2021, announcing plans to raise at least $20 billion.[3]
Demand reportedly reached $85 billion, more than three times the initial amount, and the final deal was upsized to $25 billion across seven tranches with maturities ranging from two to 30 years.[4] On 16 June 2026, NVDA shares fell approximately 1.7% after the deal was priced, and the stock has continued to drift lower since.[5]
Key Levels on the Nvidia Stock Price Chart
The table below covers the zones active as of 07:55 UTC on 18 June 2026 (15:55 GMT+8). These are reference levels, not trade signals.
| Level | Price | Type | Note |
| Current price | $204.67 | – | 07:55 UTC, 18 Jun 2026 |
| 50-period MA | $206.34 | Resistance | Vantage NVDA CFD 15-min |
| 200-period MA | $207.87 | Resistance | MA cluster overhead band |
| Near support | ~$202.50 | Support | Recent session floor |
| Round number | $200.00 | Support watch | Psychological level below |
Table 1: Key levels as of 07:55 UTC, 18 June 2026. Sources: Vantage NVDA CFD, TradingView. Indicative only.
The $206.34 MA is the more immediate overhead point. Price needs to reclaim and hold that level before the $207.87 MA comes into focus. The $202.50 zone has acted as a floor in recent sessions; a clear move below would shift attention toward $200. The RSI at 38.52 leaves room to continue declining without reaching extreme oversold readings.
What to Watch
- Annual Shareholder Meeting, 24 June 2026: NVDA confirmed its 2026 meeting will be held online. Commentary around capital allocation, AI infrastructure, or export controls could attract renewed attention to the nvidia share price.
- Q2 FY2027 Earnings, 26 August 2026: NVDA’s next earnings report is confirmed for 26 August 2026. The $91.0 billion (+/-2%) Q2 guidance remains the forward reference point analysts are tracking.
- Export control watch: NVDA noted in its Q1 10-Q that no Hopper Data Centre shipments to China occurred in the quarter, vs. $4.6 billion in Q1 FY2026. Any change to US export licensing requirements remains a watch point for the nvidia stock forecast.
Stop Loss and Leverage Considerations
With price compressed between the $202.50 support zone and the $206.34-$207.87 MA band, market participants often monitor Stop Loss placement carefully in tight ranges. Standard percentage-based stops can sit closer to current price than intended in these conditions, raising the risk of an exit on normal price noise rather than a genuine directional move. Reviewing exposure across correlated technology and semiconductor names is relevant given the current setup.
Trading the Vantage NVDA CFD involves leverage. Leverage amplifies both gains and losses relative to margin deployed, and losses can exceed the initial deposit. Position sizing relative to account equity is worth reviewing ahead of binary events such as the 24 June shareholder meeting, where headline developments can trigger rapid intraday moves.

RISK WARNING: CFDs are complex financial instruments and carry a high risk of losing money rapidly due to leverage. You should ensure you fully understand the risks involved and carefully consider whether you can afford to take the high risk of losing your money before trading.
Disclaimer: The information is provided for educational purposes only and doesn’t take into account your personal objectives, financial circumstances, or needs. It does not constitute investment advice. We encourage you to seek independent advice if necessary. The information has not been prepared in accordance with legal requirements designed to promote the independence of investment research. No representation or warranty is given as to the accuracy or completeness of any information contained within. This material may contain historical or past performance figures and should not be relied on. Furthermore estimates, forward-looking statements, and forecasts cannot be guaranteed. The information on this site and the products and services offered are not intended for distribution to any person in any country or jurisdiction where such distribution or use would be contrary to local law or regulation.
References
[1] “NVIDIA Announces Financial Results for First Quarter Fiscal 2027 – SEC (NVIDIA 8-K)” https://www.sec.gov/Archives/edgar/data/0001045810/000104581026000051/q1fy27pr.htm Accessed on 18 June 2026.
[2] “Nvidia Q1 revenue hits $81.6B, ups dividend, buyback – StockTitan / Globe Newswire” https://www.stocktitan.net/news/NVDA/nvidia-announces-financial-results-for-first-quarter-fiscal-fq78amc9h84m.html Accessed on 18 June 2026.
[3] “Nvidia joins AI borrowing frenzy with $20 billion bond issue – Yahoo Finance” https://finance.yahoo.com/markets/stocks/articles/nvidia-20-billion-bond-offering-160604626.html Accessed on 18 June 2026.
[4] “NVIDIA (NVDA) Plans $25 Billion Investment-Grade Bond Issue Amid High Demand – GuruFocus” https://www.gurufocus.com/news/8917439/nvidia-nvda-plans-25-billion-investmentgrade-bond-issue-amid-high-demand Accessed on 18 June 2026.
[5] “NVIDIA (NVDA) Issues $25 Billion Bond to Support AI Investments – GuruFocus” https://www.gurufocus.com/news/8918942/nvidia-nvda-issues-25-billion-bond-to-support-ai-investments Accessed on 18 June 2026.
[6] “Nvidia earnings takeaways: Data center revenue nearly doubles, report is strong but stock slides – CNBC” https://www.cnbc.com/2026/05/20/nvidia-nvda-earnings-report-q1-2027.html Accessed on 18 June 2026.
[7] “NVIDIA Stock Price History – Investing.com” https://www.investing.com/equities/nvidia-corp-historical-data Accessed on 18 June 2026.
[8] “NVIDIA Corporation (NVDA) Stock Price and History – Yahoo Finance” https://finance.yahoo.com/quote/NVDA/history/ Accessed on 18 June 2026.
Key Points In This Article

Latest Financial Market News


Market News Tags
- # USD News
- # USDCAD News
- # USDJPY News
- # USDX News
- # Forex News
- # Forex News Today
- # GBPUSD News
- # EURUSD News
- # Currency Trading News
- # AUDUSD news
Related Articles
- US Dollar Index Falls to 98.55 as Yields Ease, Fed Splits
- [DAILY TRADING] Pfizer Stock Price Today 21 August 2026 – $27.82 After CEO’s $1M Share Purchase
- [DAILY TRADING] AUD/USD Analysis 21 August 2026 — AUD/USD Hits 0.7150 as Dollar Slides, Aussie Jobs Miss
- [DAILY TRADING] Nasdaq 100 21 August 2026 – Climbs Back to 29,347 as Wall Street Waits on Jackson Hole
- PLTR Stock Price Today: August 2026 Chart Breakout & Key Levels
- [DAILY TRADING] Oracle Stock 21 August 2026 – ORCL Holds $142 as Pipeline Delay Meets Debt Fears
- [DAILY TRADING]: EUR/USD Analysis 21 August 2026 — EUR/USD Holds 1.1697, Near 3-Month High, ECB Hike Bets Firm
- [DAILY TRADING] Alibaba 21 August 2026 – BABA Stock Price Rebounds to $130.57 After Earnings Miss