
-

-


Download App
-


-

-

-
Search query too short. Please enter a full word or phrase.
-

Keywords
- Forex Trading
- Vantage Rewards
- Spreads
Popular Search
- Trading Accounts
- MT4
- MT5
- Copy Trading
- Promotions





Language


Commodities NewsCommodity Market NewsCPI NewsEconomic News TodayFeatured NewsFederal Reserve NewsFinancial NewsGold NewsGold News TodayGold Price NewsInterest Rate NewsMarket News TodayTechnical analysisTrending NewsVantage News
XAUUSD Price Today: Gold Slips to $4,315 as Fed Hike Odds Fade

Vantage Editorial Team >
14 August 2026 | Market Analysis | 11 min read
Vantage Editorial Team >
Vantage is a global, multi-asset broker with a team of in-house writers and market analysts who produce educational and insightful trading content for traders of all levels.
Gold is having one of those weeks where the chart argues with the headlines and, so far, the chart is winning. As of 14 August 2026, 10:00 (GMT+8), the Vantage XAUUSD CFD trades near $4,315, down from a peak above $4,440 earlier this month. The gold price today is really a story about two US inflation reports and a Fed that cannot quite decide which way it is leaning. This piece reads the XAUUSD chart, walks through the gold news behind the pullback, and lays out the levels worth watching into next month’s rate decision. All prices are as of the cut-off above unless stated otherwise. Charts are indicative and from TradingView. This is not financial advice.
Key Points
- Gold has retraced to around $4,315 after touching a multi-week high above $4,440 in early August, with the Relative Strength Index (RSI) cooling from overbought territory.
- Softer-than-expected US Producer Price Index (PPI) data on 13 August pulled the market-implied chance of a September Fed rate hike below 40%, extending a slide that started with an in-line CPI report a day earlier.
- Middle East conflict risk around the Strait of Hormuz remains the main upside driver for gold, even as easing rate-hike expectations have taken some pressure off the US Dollar.
What the Chart is Showing
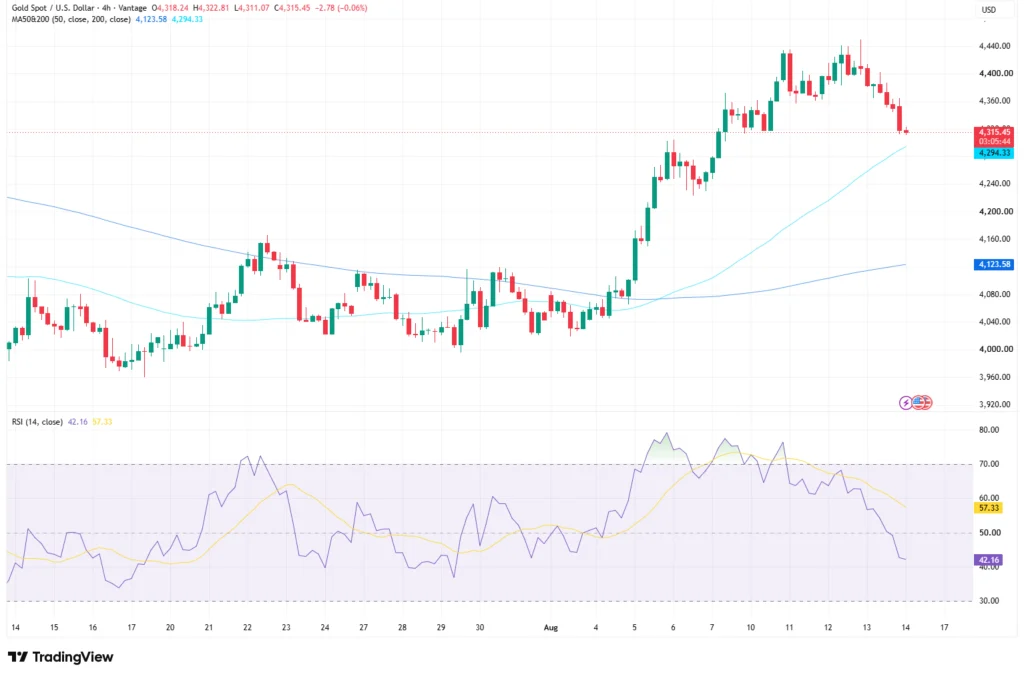
On the four-hour XAUUSD chart, the Vantage XAUUSD CFD trades at $4,315.45, inside a session range of $4,311.07 to $4,322.81 as of the cut-off above. 1 That is well below the $4,440 area gold touched around 10 to 11 August, though calling this a reversal would be getting ahead of the tape; the slide has been gradual, not panicked.
Price still sits above both moving averages on this setup: the faster 50-period average at $4,294.33, sitting just beneath the current print, and the slower 200-period average further back at $4,123.58, which still carries the weight of July’s lower consolidation. 1 Price above the fast average, itself above the slow average, is the textbook shape of an uptrend that is pausing rather than breaking. Per the TradingView setup used for this analysis, the 14-period RSI has eased to 42.16 from a reading above 70 earlier in the month, and now sits below its own moving average near 57.33. 1
An RSI that crosses below its own signal line after an overbought spike usually describes fading momentum rather than a fresh downtrend, especially when the moving averages underneath have not turned over. Zoom out and gold’s 2026 range still looks enormous: the metal hit an all-time high of $5,602.225 on 29 January 2026, corrected roughly 29.7% into a 30 June low, and has spent the summer clawing most of that back. 2,3
The Forces Driving Gold This Week

Two US inflation reports have done most of the heavy lifting behind this week’s XAUUSD news. The July Consumer Price Index (CPI), released on 12 August, showed headline inflation cooling for a second straight month to 3.4% year-on-year, with a 0.1% monthly gain and core CPI at 2.5% year-on-year, both matching forecasts. 4 Going into that release, money markets had the September rate decision close to a coin flip; the in-line print nudged the implied odds of a 25-basis-point hike down to 42%. 4
The bigger move followed the July Producer Price Index (PPI) on 13 August. Headline producer prices were flat month-on-month, below the 0.2% consensus, while core PPI rose 0.2% against a forecast of 0.3%. 1 That pulled the implied probability of a hike at the 16 September Federal Open Market Committee (FOMC) meeting below 40%, per the CME FedWatch Tool. 1,5 That is a notable shift for a Federal Reserve that left its target range unchanged at 3.50% to 3.75% at its 29 July meeting on a 9-3 vote, the most divided FOMC decision since September 2016, with the three dissenters preferring a hike, not a cut. 6
Middle East conflict risk is the stubborn counterweight to all of this. Uncertainty around shipping access through the Strait of Hormuz has kept an energy-driven inflation risk very much alive, and comments from Iranian officials this week did nothing to calm it. 1 Cooler inflation data pulling against a live geopolitical risk premium is a decent working explanation for why gold has held a fairly narrow range instead of extending the slide. As safe haven assets go, gold is currently getting pulled in two directions at once, which is a fair description of most of August so far.
Levels to Watch
| Level Type | Price (Vantage XAUUSD CFD) | What It Reflects |
|---|---|---|
| Resistance 2 | $4,440 | The August high, and the multi-week high this piece keeps circling back to |
| Resistance 1 | $4,385 | A supply zone below the August high, flagged in recent daily-chart analysis |
| Support 1 | $4,294 | Confluence with the 50-period moving average |
| Support 2 | $4,230 | The upper edge of the prior consolidation shelf |
| Support 3 | $4,123 | Confluence with the slower 200-period moving average |
Table 1: Key XAUUSD levels as of 14 August 2026, 10:00 (GMT+8). Source: Vantage XAUUSD CFD, TradingView. Indicative only.
A close back above $4,385 would put the $4,440 high back in view. A move below $4,294 would put the 50-period average in the rearview mirror, with the consolidation shelf near $4,230 and the slower 200-period average near $4,123 as the next levels beneath it. 1,7 Gold’s pullback has also lined up with the US Dollar Index (DXY) steadying, a relationship worth keeping half an eye on given the two typically move in opposite directions.
What to Watch this Week and Beyond
- US Retail Sales, 14 August: the next data point markets will use to gauge consumer demand alongside the inflation picture. 1
- Fed commentary, through late August: remarks on the three dissenting July votes will be watched closely for clues ahead of the September decision.
- Strait of Hormuz developments: any credible easing of shipping-transit risk would take some air out of the energy-driven inflation premium currently supporting gold; renewed disruption would likely do the opposite.
- FOMC meeting, 16 September: the next scheduled rate decision, and the event this whole pullback is currently being priced against. 5,6
On risk management: Stop Loss discipline is worth a second look whenever a market retraces after a sharp rally, since a level that held on the way up will not necessarily hold on the way down. Gold’s four-hour ranges have widened again this month, and standard intraday assumptions are less reliable while the Fed-odds story is still being written.
On leverage and exposure: leverage on the Vantage XAUUSD CFD depends on account type and region, running as high as 1:2000 on standard accounts, and it cuts both ways in a market that is currently moving fast on every data surprise. Position sizing relative to account equity is worth revisiting ahead of the 16 September FOMC decision. For the wider picture, Vantage’s gold news and gold price news tags track the day-to-day moves, and the CPI news tag covers the policy side in more depth.
RISK WARNING: CFDs are complex financial instruments and carry a high risk of losing money rapidly due to leverage. You should ensure you fully understand the risks involved and carefully consider whether you can afford to take the high risk of losing your money before trading.
Disclaimer: The information is provided for educational purposes only and doesn’t take into account your personal objectives, financial circumstances, or needs. It does not constitute investment advice. We encourage you to seek independent advice if necessary. The information has not been prepared in accordance with legal requirements designed to promote the independence of investment research. No representation or warranty is given as to the accuracy or completeness of any information contained within. This material may contain historical or past performance figures and should not be relied on. Furthermore estimates, forward-looking statements, and forecasts cannot be guaranteed. The information on this site and the products and services offered are not intended for distribution to any person in any country or jurisdiction where such distribution or use would be contrary to local law or regulation.
References
[1] “Gold Forecast, News and Analysis (XAU/USD) – FXStreet” https://www.fxstreet.com/commodities/gold Accessed on 14 August 2026.
[2] “XAUUSD Chart — Gold Spot Price Today – TradingView” https://www.tradingview.com/symbols/XAUUSD/ Accessed on 14 August 2026.
[3] “Gold Technical Analysis: 200-Day Moving Average Retest – Barchart.com” https://www.barchart.com/futures/quotes/GCQ26 Accessed on 14 August 2026.
[4] “CPI Inflation Report July 2026 – CNBC” https://www.cnbc.com/2026/08/12/cpi-inflation-report-july-2026.html Accessed on 14 August 2026.
[5] “CME FedWatch Tool User Guide – CME Group” https://www.cmegroup.com/tools-information/quikstrike/cme-fedwatch-tool-user-guide.html Accessed on 14 August 2026.
[6] “Fed Rate Decision July 2026: Divided Fed Holds Interest Rates Steady – CNBC” https://www.cnbc.com/2026/07/29/fed-rate-decision-july-2026.html Accessed on 14 August 2026.
[7] “XAU USD Historical Data – Investing.com” https://www.investing.com/currencies/xau-usd-historical-data Accessed on 14 August 2026.
[8] “Gold Price Forecast: XAU/USD Poised for August Breakout After Six Weeks of Consolidation – Forex.com” https://www.forex.com/en-sg/news-and-analysis/gold-price-forecast-xau-usd-poised-for-august-breakout-after-six-weeks-of-consolidation-8-1-2026/ Accessed on 14 August 2026.
[9] “Gold Weekly Forecast: Bullish Pressure Builds on Easing Fed Rate Hike Bets – FXStreet” https://www.fxstreet.com/analysis/gold-weekly-forecast-bullish-pressure-builds-on-easing-fed-rate-hike-bets-202608071423 Accessed on 14 August 2026.
Key Points In This Article

Latest Financial Market News


Market News Tags
- # USD News
- # USDCAD News
- # USDJPY News
- # USDX News
- # Forex News
- # Forex News Today
- # GBPUSD News
- # EURUSD News
- # Currency Trading News
- # AUDUSD news
Related Articles
- US Dollar Index Falls to 98.55 as Yields Ease, Fed Splits
- [DAILY TRADING] Pfizer Stock Price Today 21 August 2026 – $27.82 After CEO’s $1M Share Purchase
- [DAILY TRADING] AUD/USD Analysis 21 August 2026 — AUD/USD Hits 0.7150 as Dollar Slides, Aussie Jobs Miss
- [DAILY TRADING] Nasdaq 100 21 August 2026 – Climbs Back to 29,347 as Wall Street Waits on Jackson Hole
- PLTR Stock Price Today: August 2026 Chart Breakout & Key Levels
- [DAILY TRADING] Oracle Stock 21 August 2026 – ORCL Holds $142 as Pipeline Delay Meets Debt Fears
- [DAILY TRADING]: EUR/USD Analysis 21 August 2026 — EUR/USD Holds 1.1697, Near 3-Month High, ECB Hike Bets Firm
- [DAILY TRADING] Alibaba 21 August 2026 – BABA Stock Price Rebounds to $130.57 After Earnings Miss