
-

-


Download App
-


-

-

-
Search query too short. Please enter a full word or phrase.
-

Keywords
- Forex Trading
- Vantage Rewards
- Spreads
Popular Search
- Trading Accounts
- MT4
- MT5
- Copy Trading
- Promotions





Language

 Market Analysis Daily Analysis [DAILY TRADING] DJ30 Analysis 18 August 2026: Dow Jones Falls as Oil Jumps and Yields Hit 2007 High
DJ30 NewsEarnings News TodayFeatured NewsFinancial NewsMarket News TodayStock Market NewsStock Market News TodayTechnical analysisTrending NewsVantage News
[DAILY TRADING] DJ30 Analysis 18 August 2026: Dow Jones Falls as Oil Jumps and Yields Hit 2007 High

Vantage Editorial Team >
18 August 2026 | Daily Analysis | 9 min read
Vantage Editorial Team >
Vantage is a global, multi-asset broker with a team of in-house writers and market analysts who produce educational and insightful trading content for traders of all levels.
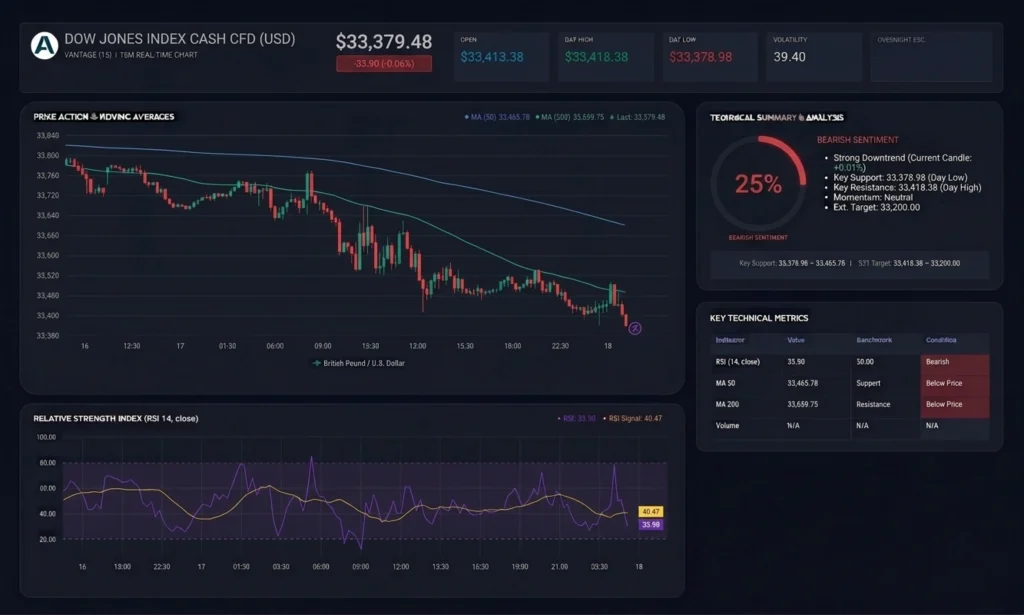
Well, that escalated. The Dow Jones index spent last week looking almost bulletproof, and this morning it looks anything but. The Vantage DJ30 CFD traded at 53,379.48 as of 15:58 (GMT+8) on 18 August 2026, down 33.90 points, or 0.06%. That follows Monday, when the official Dow Jones average closed at 53,459.78, down 272.63 points, or 0.51%, from Friday’s close of 53,732.41. 1,9
This is where Dow Jones news meets the Dow Jones chart above. Below, we walk through what the current Dow Jones index chart shows, then what is behind the move. No calls on where price goes next, just a clear read of where the Dow Jones sits right now.
Today’s Dow Jones Index At A Glance
| Metric | Reading | As Of |
| Vantage DJ30 CFD Price | 53,379.48 (-33.90 / -0.06%) | 15:58 GMT+8, 18 Aug 2026 |
| 50-Period Moving Average | 53,659.75 | Same cut-off |
| 200-Period Moving Average | 53,465.78 | Same cut-off |
| 14-Period RSI | 33.90 (MA 40.47) | Same cut-off |
| 52-Week Range | 44,579.03 to 54,744.33 | Investing.com, 18 Aug 2026 |
Below both moving averages and with the RSI sliding, the current Dow Jones index chart looks tired rather than terrified, which is a different thing entirely.
What Today’s DJ30 Chart is Actually Showing
Pull up the 15-minute Dow Jones index chart and the story is easy to follow. Price pulled back from a swing high near 53,780, printed early in this chart window before Friday’s close, then extended lower through Monday’s steep sell-off into Tuesday, a run of lower highs and lower lows. An attempt to rally back above the 200-period moving average, in the 53,465 to 53,485 zone, formed early on 18 August and briefly looked like it might stick. It did not. The red candles that followed dragged the CFD to a fresh session low of 53,378.98 by the 15:58 (GMT+8) cut-off.
Moving Averages and RSI: A Shaky setup, Not A Verdict
Two moving averages frame the picture, and neither flatters. The 50-period moving average sits at 53,659.75, sloping lower since the swing high described above. The 200-period moving average sits at 53,465.78 and briefly acted as support during the early 18 August bounce, before price fell back below it, leaving the current Dow Jones index CFD beneath both lines.
The 14-period RSI, attributed to the TradingView setup used here, reads 33.90, below its own moving average of 40.47, having climbed closer to 60 earlier before reversing hard alongside the decline above. A reading in the low 30s sits close to, but has not reached, the 30 level widely used as an oversold threshold. Close, but no cigar; whether it extends lower or stabilises is not something one reading settles alone.
What’s Actually Driving Dow Jones Sentiment Today
Monday’s decline coincided with a jump in crude oil and a sharp move higher in long-dated US Treasury yields, after a US-Iran memorandum of understanding expired at the start of the week. 1,8 Brent crude traded above $89 and WTI above $82 5, while the 30-year Treasury yield rose to 5.31%, its highest since 2007.2,3 Dow futures extended lower into early Tuesday premarket trading on the same backdrop. 4
It is not all macro, either. Dow Jones stocks have their own week: Home Depot is due to report second-quarter results before Tuesday’s open, the first of this week’s major US retail earnings, with Lowe’s due Wednesday 19 August 2026. 7 Those results will be read alongside a softer signal already in hand: University of Michigan Consumer Sentiment fell to 51.0 in August from 55.2 in July. 6 None of this points to a single direction; it is several stories landing in the same week.
What to Watch Next for DJ30 Traders
The CFD’s position below its 200-period moving average, and the RSI’s slide toward 30, are chart-based observations, not a signal to trade on. Home Depot’s results later on 18 August, followed by Lowe’s on Wednesday, are the next scheduled data points that could move sentiment across US indices. 7 Given the size of Monday’s move, outsized intraday swings are more likely than usual across Contracts for Difference (CFDs) on the Dow Jones index, which involve leverage and carry a high risk of losing money rapidly. A Stop Loss order does not prevent losses outright, but can help limit them to a planned size relative to account equity.
Leverage is a double-edged tool: it amplifies the outcome of a CFD position either way and never removes the uncertainty described here. Position sizing proportional to account equity, not the chart level, remains a foundational habit into this week’s reports. For more Dow Jones news, head to Vantage Markets.
RISK WARNING: CFDs are complex financial instruments and carry a high risk of losing money rapidly due to leverage. You should ensure you fully understand the risks involved and carefully consider whether you can afford to take the high risk of losing your money before trading.
Disclaimer: The information is provided for educational purposes only and doesn’t take into account your personal objectives, financial circumstances, or needs. It does not constitute investment advice. We encourage you to seek independent advice if necessary. The information has not been prepared in accordance with legal requirements designed to promote the independence of investment research. No representation or warranty is given as to the accuracy or completeness of any information contained within. This material may contain historical or past performance figures and should not be relied on. Furthermore estimates, forward-looking statements, and forecasts cannot be guaranteed. The information on this site and the products and services offered are not intended for distribution to any person in any country or jurisdiction where such distribution or use would be contrary to local law or regulation.
References
[1] “How Major US Stock Indexes Fared Monday 8/17/2026 – AP via KVUE” https://www.kvue.com/article/syndication/associatedpress/how-major-us-stock-indexes-fared-monday-8172026/616-1bf877f2-1b6d-4690-924a-bf82514590a8 Accessed on 18 August 2026.
[2] “US Bond Selloff Drives 30-Year Yields to Highest Since 2007 – Bloomberg” https://www.bloomberg.com/news/articles/2026-08-17/us-bond-selloff-drives-30-year-yields-to-the-highest-since-2007 Accessed on 18 August 2026.
[3] “30-Year Treasury Yield Tops 5.31%, the Highest in 19 Years – CNBC” https://www.cnbc.com/amp/2026/08/17/treasury-yields-federal-reserve-fomc-minutes.html Accessed on 18 August 2026.
[4] “Stock Futures Are Little Changed After Wall Street Starts the Week With Losses, Hurt by Higher Oil Prices and Rising Yields: Live Updates – CNBC” https://www.cnbc.com/2026/08/17/stock-market-today-live-updates.html Accessed on 18 August 2026.
[5] “Dow Loses More Than 270 Points as Oil Prices Pressure Stocks Amid Rising Iran Tensions – CNBC” https://www.cnbc.com/2026/08/16/stock-market-today-live-updates-.html Accessed on 18 August 2026.
[6] “S&P 500 Closes Lower, But Posts Third Straight Weekly Gain: Live Updates – CNBC” https://www.cnbc.com/2026/08/13/stock-market-today-live-updates.html Accessed on 18 August 2026.
[7] “Stifel Raises Home Depot Stock Price Target on Platform Strength – Investing.com” https://www.investing.com/news/analyst-ratings/stifel-raises-home-depot-stock-price-target-on-platform-strength-93CH-4862844 Accessed on 18 August 2026.
[8] “Stock Market Today: Dow, S&P 500, Nasdaq Fall as Oil Rises Amid US-Iran Tensions, 30-Year Yield Hits Highest Level in Decades – Yahoo Finance” https://finance.yahoo.com/markets/live/stock-market-today-monday-august-17-dow-sp-500-nasdaq-094421171.html Accessed on 18 August 2026.
[9] “Dow Jones Industrial Average Historical Data – Investing.com” https://www.investing.com/indices/us-30-historical-data Accessed on 18 August 2026.
Key Points In This Article

Latest Financial Market News


Market News Tags
- # USD News
- # USDCAD News
- # USDJPY News
- # USDX News
- # Forex News
- # Forex News Today
- # GBPUSD News
- # EURUSD News
- # Currency Trading News
- # AUDUSD news
Related Articles
- US Dollar Index Falls to 98.55 as Yields Ease, Fed Splits
- [DAILY TRADING] Pfizer Stock Price Today 21 August 2026 – $27.82 After CEO’s $1M Share Purchase
- [DAILY TRADING] AUD/USD Analysis 21 August 2026 — AUD/USD Hits 0.7150 as Dollar Slides, Aussie Jobs Miss
- [DAILY TRADING] Nasdaq 100 21 August 2026 – Climbs Back to 29,347 as Wall Street Waits on Jackson Hole
- PLTR Stock Price Today: August 2026 Chart Breakout & Key Levels
- [DAILY TRADING] Oracle Stock 21 August 2026 – ORCL Holds $142 as Pipeline Delay Meets Debt Fears
- [DAILY TRADING]: EUR/USD Analysis 21 August 2026 — EUR/USD Holds 1.1697, Near 3-Month High, ECB Hike Bets Firm
- [DAILY TRADING] Alibaba 21 August 2026 – BABA Stock Price Rebounds to $130.57 After Earnings Miss