
-

-


Download App
-


-

-

-
Search query too short. Please enter a full word or phrase.
-

Keywords
- Forex Trading
- Vantage Rewards
- Spreads
Popular Search
- Trading Accounts
- MT4
- MT5
- Copy Trading
- Promotions





Language

 Market Analysis Weekly Analysis Brent Crude Oil Price Near $91.70 as Iran Truce Lapses: What the UKOUSD and USOUSD Charts Are Telling Us
Brent Crude Oil NewsCommodities NewsCommodity Market NewsCrude Oil News TodayEconomic News TodayFeatured NewsMarket News TodayOil NewsOil Price News TodayTechnical analysisTrending NewsVantage NewsWTI Crude OIl News
Brent Crude Oil Price Near $91.70 as Iran Truce Lapses: What the UKOUSD and USOUSD Charts Are Telling Us

Vantage Editorial Team >
18 August 2026 | Market Analysis | 12 min read
Vantage Editorial Team >
Vantage is a global, multi-asset broker with a team of in-house writers and market analysts who produce educational and insightful trading content for traders of all levels.
The crude oil price chart in one sentence: Brent is back within a whisker of its late-July highs, and it got there without a single fresh headline this week.
Brent crude oil, tracked through Vantage’s UKOUSD CFD, traded near $91.70 a barrel on 18 August 2026. WTI crude oil price, tracked via the USOUSD CFD, held near $84.80.1 Both crude oil prices are sitting close to levels last seen in late July, and the timing lines up with something specific: the US-Iran ceasefire memorandum technically lapsed on 17 August without a renewal.2,3
The chart levels quoted throughout come from the Vantage CFD feed, captured on 18 August 2026 at 10:31 (GMT+8). Crude oil prices today move fast intraday, so treat every level below as a snapshot, not a running total.
This is the crude oil news today story in full: what the charts on both benchmarks are actually showing, why the risk premium in the oil price has refused to fade, what the supply data is doing underneath the geopolitics, and what a month like this one means for how you manage risk on UKOUSD and USOUSD.
What the UKOUSD and USOUSD Charts Are Showing
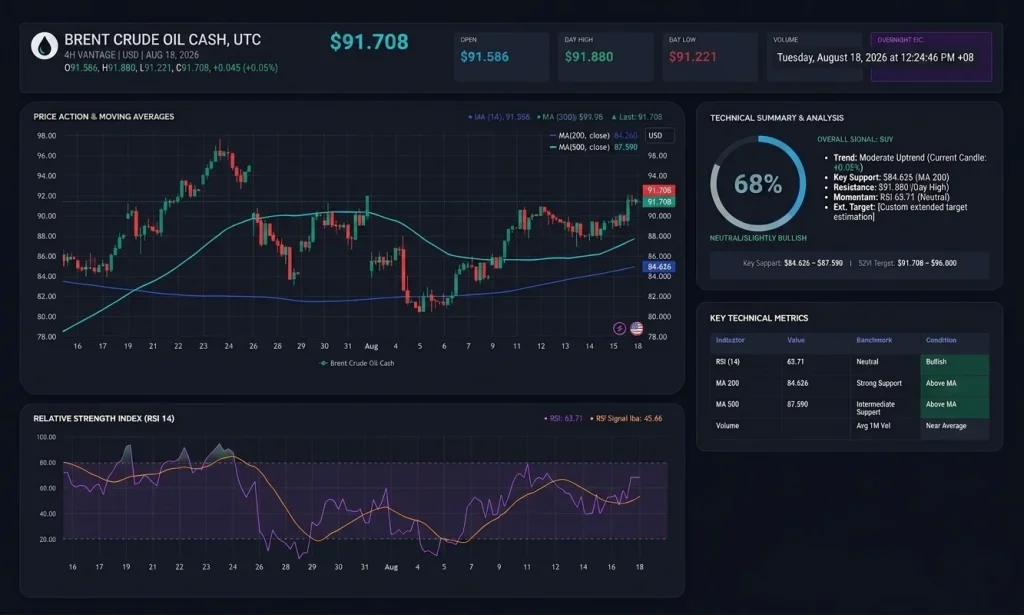
Pull up the Brent (UKOUSD) 4-hour chart and the shape practically tells its own story. Price ran from around $78 in mid-July to a peak near $97.70 by 23-24 July, then gave almost all of it back, falling to lows near $78-80 by 5 August. From there it turned around again, and that second leg has now carried the close to $91.708, above both the 50-period moving average ($84.626) and the 200-period moving average ($87.590) on the TradingView setup used for this analysis. RSI (14) reads 63.71 against its own moving average of 55.66, which puts momentum in constructive territory without pushing into the 70 zone usually read as overbought.
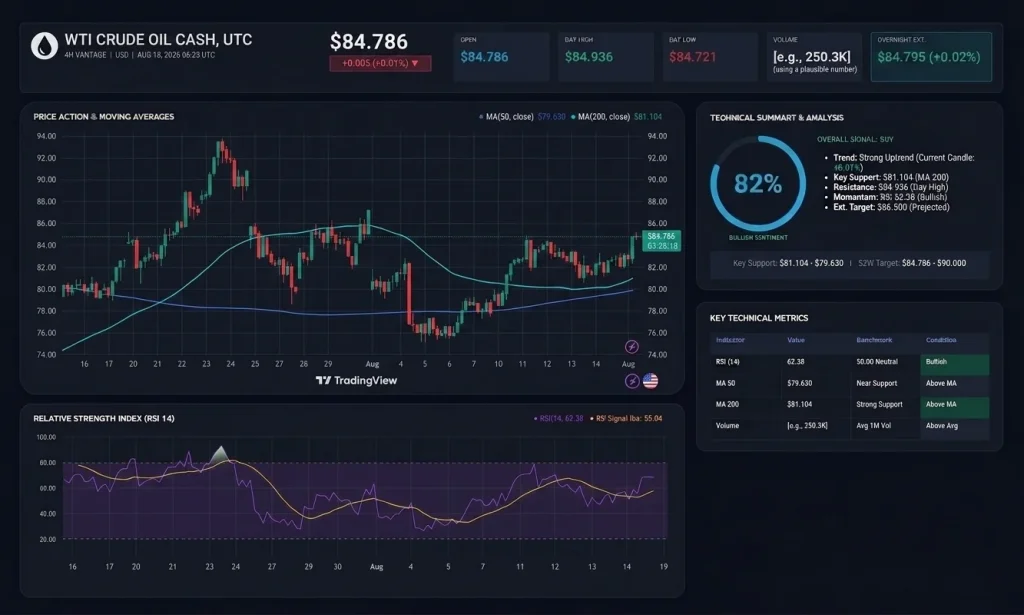
WTI (USOUSD) has drawn a similar shape on a smaller scale. It peaked near $93.90 in late July, fell to lows near $74-76 in early August, and has recovered to a close of $84.786, sitting above its 50-period MA ($79.630) and 200-period MA ($81.104). RSI (14) is at 62.38 versus a moving average of 55.04, sitting just below Brent’s own RSI reading.
Neither oil price chart has reclaimed its July high yet, so the broader range isn’t broken. What we’ve got instead is a V, not a straight line: a fast climb into late July, a sharp giveback into early August, and a second rally that has clawed back most, but not all, of the ground lost. That’s a chart worth watching, not a chart worth calling.
Why Crude Oil Prices Are Holding Near Multi-Week Highs

The backdrop hasn’t changed much, and that’s arguably the point. This is still the same Middle East conflict involving the US, Israel, and Iran that has run through most of 2026. A memorandum of understanding signed in mid-June set a window for wider negotiations, and that window technically expired on 17 August with no comprehensive deal in place.3
Reporting on 17 August described Washington as in no rush to extend the arrangement, with talks between the two sides characterised by one White House official as static.1.2 Shipping data has tanker traffic through the Strait of Hormuz sitting near a standstill in recent sessions, as low as three crossings on one day against a five-day average of twelve, compared with roughly 130 transits before the conflict started.2 Worth being precise here: that’s not the same as the strait being formally closed. Some crude is still reportedly moving through, just at a fraction of what it once was.
Add renewed Israeli strikes on Lebanon over the weekend, reports of fresh sanctions being prepared against Iran4, and Iran and Oman reportedly edging toward their own arrangement to manage Hormuz traffic without Washington4, and the picture stays genuinely tangled. Markets are pricing continued uncertainty around the diplomatic calendar rather than a resolution, which is the simplest explanation for why both benchmarks have stayed elevated in a week without a fresh escalation.
The Supply Story Underneath the Oil Price Chart
Here’s the part that gets less airtime than the tanker headlines. The International Energy Agency’s August 2026 Oil Market Report widened its third-quarter global supply deficit estimate to 1.8 million barrels per day, more than double the roughly 800,000 barrels per day estimated a month earlier, and now expects the full-year 2026 deficit to be the widest in five years.6 The Agency pinned the wider gap on renewed hostilities and maritime disruption through July and early August.
On reserves, the US Strategic Petroleum Reserve has slipped below 300 million barrels for the first time since the reserve was originally filled in the early 1980s.1 That’s a meaningful data point, because it quietly removes one of the tools that’s historically been available to cushion a genuine supply shock.
On production, seven OPEC+ members agreed on 2 August to lift September quotas by 188,000 barrels per day, completing the phased rollback of the 1.65 million barrels per day of voluntary cuts first introduced back in 2023.7,8 The group reconvenes on 6 September 2026 to review conditions, and some analysts think a pause is now plausible once the restoration programme wraps up.8 Put it all together and oil markets are pricing a structural deficit and a producer group nearing the edge of its current adjustment schedule at the same time as a geopolitical premium, not a single, tidy, one-directional story.
For traders following energy-linked CFDs, both the Hormuz diplomatic calendar and the monthly OPEC+ schedule remain the reference points to watch alongside the chart levels above. Gold, tracked via Vantage’s XAUUSD CFD, has also picked up periods of safe-haven demand during this conflict, and it’s worth a look alongside Vantage’s ongoing Brent Crude Oil News and WTI Crude Oil News coverage if you’re tracking cross-asset positioning through this period.
Reading Oil’s Volatility: Risk Management for UKOUSD and USOUSD
Oil has a long track record of moving hard in both directions, and this past month is as clean an example as you’ll get. Brent went from a late-July high near $97.70 to an early-August low near $78-80 in a couple of weeks, then clawed back more than $11 of that decline by 18 August. WTI moved through a comparable dollar range over the same stretch, from a high near $93.90 to a low near $74-76. A range that wide on either benchmark is a reminder that risk management deserves at least as much attention as whatever headline is driving the tape that day.
Stop Loss and exposure framing: With both UKOUSD and USOUSD moving through $15-20 ranges inside a single month, it’s worth reviewing how a Stop Loss order fits your own account equity and risk tolerance, rather than assuming current levels will hold or that this volatility fades quickly. For more on structuring this around a fast-moving market, Vantage’s Risk Management coverage is a useful ongoing reference.
Leverage and position sizing: UKOUSD, USOUSD, and other CFDs are traded on margin. Leverage of up to 1:1000 can magnify both potential returns and potential downside, and a conflict that has already produced two sharp multi-week swings this year can move the oil price quickly in either direction. It’s a double-edged tool, not a feature that only benefits your account balance, and position sizing proportional to account equity is a separate factor many traders build into their broader plan.
None of this constitutes a recommendation to open or close any position. It’s meant to help active multi-asset traders read the current UKOUSD and USOUSD chart setup, not to point you toward a specific trade.
RISK WARNING: CFDs are complex financial instruments and carry a high risk of losing money rapidly due to leverage. You should ensure you fully understand the risks involved and carefully consider whether you can afford to take the high risk of losing your money before trading.
Disclaimer: The information is provided for educational purposes only and doesn’t take into account your personal objectives, financial circumstances, or needs. It does not constitute investment advice. We encourage you to seek independent advice if necessary. The information has not been prepared in accordance with legal requirements designed to promote the independence of investment research. No representation or warranty is given as to the accuracy or completeness of any information contained within. This material may contain historical or past performance figures and should not be relied on. Furthermore estimates, forward-looking statements, and forecasts cannot be guaranteed. The information on this site and the products and services offered are not intended for distribution to any person in any country or jurisdiction where such distribution or use would be contrary to local law or regulation.
References
1. “CNBC Daily Open: U.S.-Iran ceasefire set to expire” – CNBC. https://www.cnbc.com/2026/08/17/cnbc-daily-open-us-iran-war-ceasefire-expire.html. Accessed on 18 August 2026
2. “Brent oil rises above $90 as Iran rules out interim deal extension, threatens to escalate conflict” – CNBC. https://www.cnbc.com/2026/08/17/oil-prices-iran-war-strait-hormuz.html. Accessed on 18 August 2026
3. “Oil Gains as the US Signals No Rush to End Conflict With Iran” – Bloomberg. https://www.bloomberg.com/news/articles/2026-08-17/latest-oil-market-news-and-analysis-for-aug-18. Accessed on 18 August 2026
4. “Brent crude oil – Price – Chart – Historical Data – News” – Trading Economics. https://tradingeconomics.com/commodity/brent-crude-oil. Accessed on 18 August 2026
5. “Brent Crude Oil Futures Price Today” – Investing.com https://www.investing.com/commodities/brent-oil. Accessed on 18 August 2026
6. “Oil Market Report – August 2026” – International Energy Agency. https://www.iea.org/reports/oil-market-report-august-2026. Accessed on 18 August 2026
7. “Organization of the Petroleum Exporting Countries – Press Release, 2 August 2026” – OPEC. https://www.opec.org/pr-detail/1854611-2-august-2026.html. Accessed on 18 August 2026
8. “OPEC+ completes rollback of oil production cuts with September hike” – Energy Connects. https://www.energyconnects.com/news/oil/2026/august/opecplus-completes-rollback-of-oil-production-cuts-with-september-hike/. Accessed on 18 August 2026
Key Points In This Article

Latest Financial Market News


Market News Tags
- # USD News
- # USDCAD News
- # USDJPY News
- # USDX News
- # Forex News
- # Forex News Today
- # GBPUSD News
- # EURUSD News
- # Currency Trading News
- # AUDUSD news
Related Articles
- US Dollar Index Falls to 98.55 as Yields Ease, Fed Splits
- [DAILY TRADING] Pfizer Stock Price Today 21 August 2026 – $27.82 After CEO’s $1M Share Purchase
- [DAILY TRADING] AUD/USD Analysis 21 August 2026 — AUD/USD Hits 0.7150 as Dollar Slides, Aussie Jobs Miss
- [DAILY TRADING] Nasdaq 100 21 August 2026 – Climbs Back to 29,347 as Wall Street Waits on Jackson Hole
- PLTR Stock Price Today: August 2026 Chart Breakout & Key Levels
- [DAILY TRADING] Oracle Stock 21 August 2026 – ORCL Holds $142 as Pipeline Delay Meets Debt Fears
- [DAILY TRADING]: EUR/USD Analysis 21 August 2026 — EUR/USD Holds 1.1697, Near 3-Month High, ECB Hike Bets Firm
- [DAILY TRADING] Alibaba 21 August 2026 – BABA Stock Price Rebounds to $130.57 After Earnings Miss